Source: The Conversation – UK – By James Dyke, Assistant Director of the Global Systems Institute, University of Exeter
Ten years ago the world’s leaders placed a historic bet. The 2015 Paris agreement aimed to put humanity on a path to avert dangerous climate change. A decade on, with the latest climate conference ending in Belém, Brazil, without decisive action, we can definitively say humanity has lost this bet.
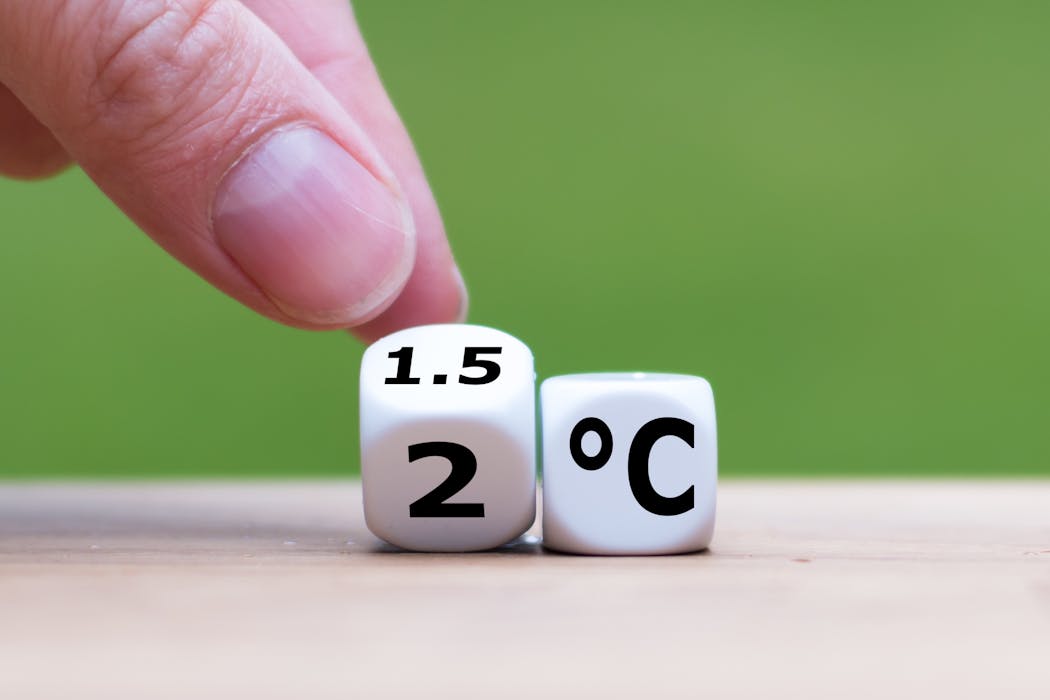
Warming is going to exceed 1.5°C. We are heading into “overshoot” within the next few years. The world is going to become more turbulent and more dangerous. So, what comes after failure?
Our attempt to answer that question gathered the Earth League – an international network of scientists we work with – for a meeting in Hamburg earlier this year. After months of intensive deliberation, its findings were published this week, with the conclusion that humanity is “living beyond limits”.
Exceed 1.5°C and not only do extreme climate events, like droughts, floods, fires and heatwaves grow in number and severity, impacting billions of people, we also approach tipping points for large Earth regulating systems like the Amazon rainforest and the Greenland and West Antarctic ice sheets. Tropical coral reef systems, livelihood for over 200 million people, are unlikely to cope with overshoot.
This translates to existential risks for billions of people. Not far in the future, but within the next few years for extreme events, and within decades for tipping points.
How global warming and social instability increase together:
The missed opportunities between 1997 and 2015 are the failures of the Kyoto protocol to bend the global emissions curve. There then followed a missed decade since the Paris agreement.
The beauty of Paris – getting all countries to commit collectively to cut emissions – has been undermined by the voluntary mechanisms to achieve it. So while staying well below 2°C is legally binding, the actions within national plans are not.
We are now at a critical juncture. We are at or very close to human caused environmental change that will fundamentally unpick the life-sustaining systems on Earth. These risk triggering feedback loops, for example, the accelerating die back of rainforests which would release billions of tons of carbon dioxide which would raise temperatures even further.
Ultimately that could cause the planet to drift away along the pathway to “hothouse Earth”, a scenario where even if emissions were reduced, self amplifying feedback loops would drive global temperature increases up to or even beyond 5°C. The last time the climate warmed by such an amount was tens of millions of year ago.
Well before this nightmare scenario, significant impacts are now unavoidable. Increasingly destructive storms will produce more loss and damages, more loss of life. Efforts to accelerate – or even maintain – decarbonisation could be undermined by social and political destabilisation created by climate change.
If the consequences of climate change begin to interfere with our efforts to deal with its causes, moves towards a more sustainable world risk being delayed or even entirely derailed.
But the scale of suffering is still very much up to us. We still have the ability to minimise overshoot. The best science can offer today, is a future where peak warming reaches 1.7°C before returning to within 1.5°C in 75 years.
This requires immediate action at global scale, on multiple fronts:
First, we’ll have to accelerate the fossil fuel phase out to achieve at least 5% annual global emission reductions from now on. This requires increasing nations’ decarbonisation plans by at least a factor of ten.
Second, we must transform the global food system within the next decade so it is able to absorb 3 billion tons of carbon dioxide a year.
Third, we need new ways to remove an additional 5 billion tonnes of carbon dioxide from the atmosphere each year, and store it safely in the ground. Whether by restoring ecosystems such as forests and wetlands or with new approaches that would directly remove carbon dioxide from the atmosphere, this must be done in safe and socially just ways.
Finally, we must do all we can to ensure continued “health” and resilience in nature on land and in the ocean, in order to safeguard Earth’s capacity to store carbon. All this needs to happen, simultaneously, to have a chance of limiting overshoot and come back to at or below 1.5°C of global warming.
Science is crystal clear here. Our only chance to recover back to a stable and safe climate is to accelerate the phase-out of fossil-fuels, remove carbon and invest in nature (on land and in the ocean), and do that without trading off between them.
![]()
The authors do not work for, consult, own shares in or receive funding from any company or organisation that would benefit from this article, and have disclosed no relevant affiliations beyond their academic appointment.
– ref. The world lost the climate gamble. Now it faces a dangerous new reality – https://theconversation.com/the-world-lost-the-climate-gamble-now-it-faces-a-dangerous-new-reality-270392