Global copper demand outstrips supply, threatening electrification and industrial growth

Source: The Conversation – USA (2) – By Morgan Bazilian, Professor of Public Policy and Director of the Payne Institute, Colorado School of Mines

Capstone Copper’s Pinto Valley Mine in Miami, Arizona. Jim West/UCG/Universal Images Group via Getty Images

Demand for copper is surging because of demand from new technologies, but suppliers are struggling to keep up, and they are likely to fall further behind in the coming years, resulting in shortfalls globally. Even though copper prices are at historically high levels, the financial risk involved in mining means that prices will need to go much higher before mining companies see profit in addressing the supply shortage.

Those are the key findings from our March 2026 analysis of the global copper market.

Copper is an essential material that is used in generating and distributing electrical power; cables, wires, motor windings, transformers and cooling equipment in data centers; and advanced manufacturing of consumer and defense products.

It’s so important that in 2025, the U.S. Geological Survey designated copper as a mineral “vital to the U.S. economy and national security.”

Copper is abundant in the ground, but there’s not enough being extracted to be able to meet the demand. That’s because investors want higher and more reliable returns than copper mines currently offer, and the industry faces complex permitting processes and can’t find enough workers. Our analysis found that for new technologies to continue to develop, and for the global economy to continue to grow, even higher prices are ahead.

Few options other than mining

In the United States, the increased effort to build data centers for artificial intelligence systems has created a massive need for copper. Car manufacturers require some copper for internal combustion vehicles and four to five times more for the batteries and other parts of electric vehicles. In addition, as global temperatures increase, demand for power-hungry air conditioning in many emerging and developing economies has been growing, too, requiring copper inside the equipment and more wiring to power them.

Recycling existing copper could help reduce the amount needed from new mines, but it would not be enough to meet the rising demand. Even under generous assumptions, we found that recycling might provide 35% of the global copper supply by 2050, with mining producing the remaining 65%.

Substituting another material for copper won’t really work either – at least in the short-to-medium term. Copper has an unmatched combination of physical properties such as electrical conductivity, durability and flexibility – which is why it became popular for so many purposes in the first place.

Aluminum could replace it in some cases, but not all – and that would amount to only about 2% of total copper use.

Fiber optics can also replace copper at times. Their glass fibers can carry more data more quickly than copper wires, but they can’t also carry power. New copper substitutes, like ultra-conductive aluminum, carbon nanotubes, and niobium phosphide, are promising but still in their infancy.

Complicated circumstances

The only other way to get more copper is to mine more of it. But building a new mine can take 20 to 30 years – a period during which investors are spending money but not yet getting returns, and a time when costs can rise significantly from preliminary estimates.

If industrial and economic growth is to stay on track in the 2030s, new mines would need to be in the financing and permitting processes right now. But they aren’t.

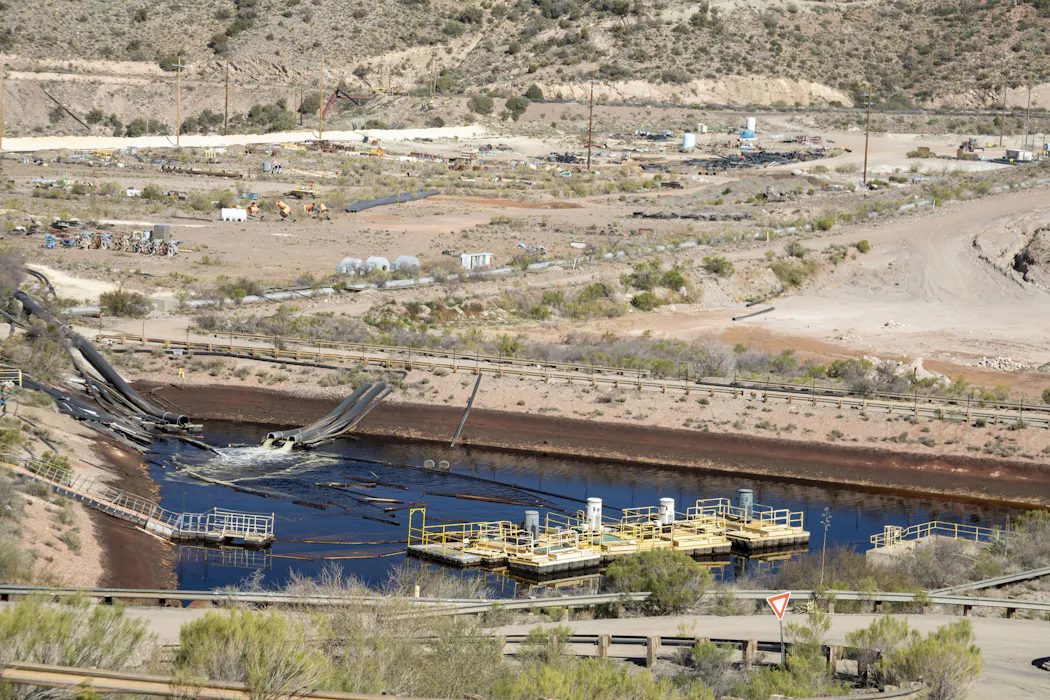
Even Resolution Copper, which started decades ago trying to develop a mine in Arizona outside Phoenix, has more work to do before being able to start mining. Since 1995, the project’s developers have spent several billion dollars on planning, permitting and legal cases.

Once in place, it could meet as much as 25% of U.S. copper demand from a high-concentration body of ore located near existing truck and rail lines.

Evaluating the environmental and community effects of proposed mining projects is essential, but in many countries there are overlapping levels of review that have different, and variable, timelines. And many parts of the process can be appealed to courts by opponents or supporters. That increases costs and imposes time delays for mine developers – and means consumers will have to wait longer, and pay more, for copper-intensive products and services.

Yet even though copper prices are near historic highs – over US$13,000 per ton on the London Metals Exchange – the profit margins are still too low and price swings are too volatile for companies to forecast reliable returns on the risky investment of building new mines.

Two large metal frames sit in a rocky landscape.
Metal structures on the site of Resolution Copper’s proposed underground copper mine in Arizona, in a place that has been sacred to Native American people for thousands of years.
Jim West/UCG/Universal Images Group via Getty Images

Global inequalities

Copper is produced in a handful of countries but used widely around the world.

That leaves copper vulnerable to national policies about imports and exports, leading to trade disruptions and price shocks.

Countries with low and middle per-capita income are likely to require substantial amounts of copper to grow their economies. Right now, wealthy countries like the U.S. and members of the European Union have about 440 pounds (200 kilograms) per person in existing physical infrastructure – electrical wiring, plumbing systems, architectural elements and transportation. But that figure is 20 pounds (9 kilograms) per person in Africa and less than 2 pounds (1 kilogram) per capita.
in India.

A large metal structure sits near a pile of rock.
A copper mine in Miami, Ariz.
Jim West/UCG/Universal Images Group via Getty Images

Shortages are likely

To get a picture of what might be possible if there were a significant global effort to increase copper availability, we evaluated several optimistic scenarios. We looked at faster permitting for new mines, higher recycling rates and smoother mining processes than those currently in place. But even then, economic development drove demand to grow far faster than the available supply.

Existing mines will have decreasing amounts of ore available and will produce less copper in 2050 than they do in 2025. Yet even if all known copper deposits with known mine-opening dates go into production as scheduled copper supplies will not keep up with demand.

Our best-case scenario has global mine production at about 30 million metric tons of copper a year by 2050. But to keep pace with global economic development, the world will need 37 million metric tons of mined copper a year by then.

To meet that additional need, more mines will need to be opened, and extra production developed – including extracting residual copper from old mine debris that was previously viewed as having too little copper to be worth processing.

An aerial view of a large industrial operation with a water pit and gravel roads.
The open-pit Cobre Panama copper mine in Donoso, Panama.
AP Photo/Matias Delacroix

A role for government

We found that more copper could be made available more quickly if permitting were streamlined in ways that preserve environmental standards but offer companies proposing new mines some predictability for regulatory approval.

If society wants more copper, faster, then people must accept that higher, more stable prices are part of the solution. Speculative trading contributes to price volatility, which complicates financial projections that are central to deal-making and makes it more expensive to invest in the large, long-term and irreversible expenses that new mines require.

Higher copper prices will ripple through the economy, raising costs for construction, energy and technology. But pretending those costs can be avoided doesn’t make them disappear. Underinvestment across the supply chain from mines to processing today shows up as bottlenecks tomorrow, including delayed grid upgrades and constrained digital growth.

The Conversation

Adam Charles Simon is a co-founder of VectOres Science, Inc.

Morgan Bazilian does not work for, consult, own shares in or receive funding from any company or organization that would benefit from this article, and has disclosed no relevant affiliations beyond their academic appointment.

ref. Global copper demand outstrips supply, threatening electrification and industrial growth – https://theconversation.com/global-copper-demand-outstrips-supply-threatening-electrification-and-industrial-growth-276843

Pittsburgh’s air pollution estimated to claim 3,000+ lives per year − and EPA rollbacks aren’t helping

Source: The Conversation – USA (2) – By Philip Landrigan, Professor of Biology, Boston College

Pittsburgh’s air pollution not only led to increased deaths, but it also had other negative effects, from lowered IQ in children to adverse birth outcomes. G Fiume/Getty Images Sport via Getty Images

In October 1948, a thick haze rolled into Donora, Pennsylvania, a steel town in the Monongahela Valley, south of Pittsburgh. For five days, toxic fumes from a zinc smelter – a plant that turns zinc ore into pure zinc metal – poured out of the factory’s stacks, became trapped in the valley and thus blanketed Donora. The air was filled with sulfur oxides, heavy metal dust and airborne particulates.

Firefighters carried 60-pound oxygen tanks door to door to relieve elderly and asthmatic victims. Nurses attended to mill workers in the infirmary, laying patients on the floor as hospital beds filled to capacity. Funeral homes ran out of space. The disaster eventually claimed 20 lives and caused chronic lung disease in many more.

In a old black and white photo, two nurses administer oxygen to patients in tented hospital beds.
In 1948, 40 patients were hospitalized in Donora, Pa., due to a smoke and fog disaster that led to the death of 20 residents.
Bettmann/Bettman Collection via Getty Images

This was one of the first clear demonstrations in the U.S. that air pollution could kill. Today, new global health research quantifying the risks of pollution exposure helps explain why disasters like Donora were so deadly, and why similar health threats persist.

As a public health researcher and a public health physician, we recently published a study in the journal Annals of Global Health on the health impacts of air pollution in southwestern Pennsylvania that shows the Pittsburgh area as a hot spot for pollution.

A turning point

Research triggered by the Donora disaster uncovered that air pollution causes serious health issues, including chronic heart disease, stroke, chronic obstructive pulmonary disease, lung cancer and diabetes in adults, and can lead to premature birth, low birth weight, stillbirth, asthma and impaired lung development in children.

Emerging evidence indicates that air pollution is also associated with dementia in adults and with IQ loss, attention-deficit/hyperactivity disorder and autism spectrum disorder in children.

Before the Donora disaster, the federal government did not regulate air quality. Pollution was legally viewed as a local nuisance – the unavoidable price of progress.

But the tragedy in Donora forced policymakers, scientists and the public to recognize that air pollution is a serious threat to health. Donora thus laid the groundwork for the Clean Air Act, the federal air pollution law initially enacted in 1963, then strengthened in 1970 and again in 1990. It also catalyzed the nation’s first air pollution research programs.

Pollution persists

Despite this progress, air pollution is still responsible for an estimated 200,000 deaths across the U.S. each year. These deaths are not evenly distributed. Instead, they are concentrated in pollution hot spots.

A riverside steel plant emits smoke from its smokestacks.
Because of its heavy industry and lack of local enforcement of the Clean Air Act, Pittsburgh is still one of the most polluted regions of the country.
Drew Angerer/Getty Images News via Getty Images

Our research shows southwestern Pennsylvania, the region around Donora and including Pittsburgh, is one of these hot spots.

Because of its steel mills, coke ovens – which burn coal to produce fuel for steel production – steep valleys that trap pollution and a history of inadequate local enforcement of the Clean Air Act, the Pittsburgh metropolitan area continues to rank among the nation’s most polluted regions.

Breaking down the new data

Fine particle air pollution, known as PM2.5, doesn’t just dirty the air in Pittsburgh and surrounding communities. It can kill people and harm children before they are even born.

To understand the full toll, we conducted an epidemiological study. Using NASA satellite images to measure pollution levels in each census tract, we linked that data to death and birth records from the Pennsylvania Department of Health.

The findings were stark. In 2019, between 3,085 and 3,467 deaths in southwestern Pennsylvania – roughly 11% to 12.5% of all adult deaths that year – were likely attributable to PM2.5 pollution. The damage extended to newborns as well: We estimated pollution caused 229 premature births, 177 infants with low birth weight and 12 stillbirths.

Using existing scientific data showing that every small increase in air pollution is linked to a measurable drop in children’s IQ, we applied that formula to Pittsburgh’s pollution levels across all 24,604 children born there in 2019. That calculation produced an estimated collective loss of more than 60,000 IQ points across the group. That’s an average of approximately 2.5 IQ points per child.

Children playing in water along a riverfront park in Pittsburgh.
Fine particulate air pollution was responsible for the loss of 2.5 IQ points per child born in Pittsburgh in 2019.
Jeff Swensen/Getty Images News via Getty Images

Importantly, many of the harms we saw in Pittsburgh occurred at PM2.5 levels below EPA’s air quality standard of 9 micrograms per cubic meter. This indicates that even low-level PM2.5 exposures carry significant risks to health.

Our findings arrive at a pivotal moment for U.S. air policy. EPA Administrator Lee Zeldin has announced his intention to raise the allowable limit for PM2.5, relax enforcement of the Clean Air Act and repeal the greenhouse gas endangerment finding, which allows the EPA to regulate the emissions that drive climate change.

The EPA has also eliminated its long-standing practice of counting the economic benefits of pollution control. According to new calculations, the EPA will count only the costs of pollution control while stripping out the economic value of lives saved – a metric known as the “value of a statistical life” that agencies have long used to justify health regulations.

What happens next?

During the first Trump administration, environmental rollbacks and a lack of pollution prevention efforts led to an estimated 20,000 deaths per year, according to the Environmental Protection Network, a nonprofit organization consisting of EPA alumni who volunteer their expertise to protect environmental integrity and public health. The deaths were clustered mostly in Southern and Midwestern states with heavy industry and lax pollution rules. States that had already put strong pollution controls in place were able to cushion the blow of the federal cutbacks.

Public health researchers point to local enforcement of the Clean Air Act as a way to limit health impacts of federal agency rollbacks. Allegheny County has legal authority under the Clean Air Act to set and enforce pollution standards stricter than federal minimums, but has not consistently used that authority.

Community and advocacy groups, including the Clean Air Council and PennEnvironment, have pushed the county health department to adopt stricter standards and increase permit enforcement. The Allegheny County Health Department holds regular public meetings where air quality rules and enforcement priorities are subject to review.

As the regulatory landscape shifts, the data from communities like southwestern Pennsylvania will be critical to understanding and documenting what is lost due to air pollution.

The Conversation

The authors do not work for, consult, own shares in or receive funding from any company or organization that would benefit from this article, and have disclosed no relevant affiliations beyond their academic appointment.

ref. Pittsburgh’s air pollution estimated to claim 3,000+ lives per year − and EPA rollbacks aren’t helping – https://theconversation.com/pittsburghs-air-pollution-estimated-to-claim-3-000-lives-per-year-and-epa-rollbacks-arent-helping-277461

Notre conception de ce qu’est un quartier a changé

Source: The Conversation – in French – By Christina Bouchard, professeur à temps partiel I Part-time professor, L’Université d’Ottawa/University of Ottawa

À Montréal, plusieurs projets de logement sont en cours, qui prévoient des aspects à l’échelle communautaire, notamment des rues piétonnes, des corridors commerciaux dynamiques, des galeries et des espaces publics. Si la construction sur des sites déjà situés au cœur de villes établies présente de nombreux avantages, la mise en œuvre de projets de densification peut entraîner également des défis complexes.


En m’appuyant sur mon expérience en tant qu’urbaniste et en enseignement de la gouvernance à l’université d’Ottawa, j’examine dans cet article des tendances qui se dégagent des projets de densification urbaine actuels.


Cet article fait partie de notre série Nos villes d’hier à demain. Le tissu urbain connaît de multiples mutations, avec chacune ses implications culturelles, économiques, sociales et – tout particulièrement en cette année électorale – politiques. Pour éclairer ces divers enjeux, La Conversation invite les chercheuses et chercheurs à aborder l’actualité de nos villes.

Construire un quartier

On peut se demander, au juste, quand a commencé cette pratique consistant à construire plusieurs bâtiments à la fois, avec les équipements communautaires (par exemple des parcs, jardins, patios, terrasses, zones de jeu, centres sportifs et culturels) en parallèle au développement de logements. L’objectif de l’urbanisme a toujours été d’organiser les espaces, tant publics que privés. Cependant, l’équilibre entre la gestion des ces espaces peut être envisagé de différentes manières et a eu des caractéristiques différentes selon les époques.

En Amérique du Nord, la commercialisation de la construction de lotissements s’est considérablement développée après la Seconde Guerre mondiale. Une nouvelle technologie de transport a vu le jour : l’automobile. La prolifération, à partir de ces années, des constructions à très faible densité, est une conséquence directe de la démocratisation de l’automobile. Le quartier Levittown, à New York, est souvent cité comme exemple à la fois de morphologies suburbaines, mais aussi de l’émergence de la construction de logements comme une chaîne de production.

En effet, le caractère homogène et standardisé du mode de vie suburbain s’accordait naturellement avec la mentalité du marché de masse de la construction immobilière, qui a rapidement donné naissance à des quartiers entiers. Les maisons construites ne reflétaient plus les préférences individuelles des propriétaires. Malgré cela, elles étaient populaires auprès des consommateurs et donc attrayantes pour les promoteurs immobiliers, qui ont pendant des décennies axé leurs activités sur ces produits.

De leur côté, les gouvernements nord-américains ont encouragé les promoteurs immobiliers à construire des banlieues en appliquant de manière rigide des règles de zonage qui séparaient les habitations des zones commerciales. Les gouvernements ont mis en place un zonage fonctionnel qui séparait les espaces résidentiels des espaces commerciaux et sociaux. La distance entre ces derniers, et même par rapport aux centres d’emploi, était souvent telle qu’il fallait disposer d’une voiture privée pour se déplacer.

En revanche, les développements actuels à Montréal (Canoë, Quartier des Lumières, Bridge-Bonaventure, Langelier, Quartier Molson, Esplanad-Cartier, etc.) mettent en avant leur accessibilité à pied et leur proximité avec les stations de métro dans leur marketing auprès des acheteurs.

Adopter le zonage à usage mixte et la piétonnisation

À la fin des années 1970, les critiques commençaient déjà à dénoncer les faiblesses des communautés trop centrées sur l’automobile (mode de vie sédentaire, problèmes de fragmentation sociale, diminution des interactions communautaires, pertes de terres agricoles, et autres coûts économiques et environnementaux).

Les tendances actuelles vers le zonage à usage mixte et la piétonnisation remontent aux années 1980, quand les urbanistes nord-américains ont commencé à organiser le mouvement du Nouvel Urbanisme. On considère généralement que les principes du mouvement comprennent :

  • La conviction qu’un bon design crée de bonnes communautés

  • Promouvoir les usages mixtes et accorder une attention particulière au design urbain de haute qualité.

  • Appréciation de l’aménagement urbain compact des villes des siècles précédents (par opposition à l’étalement urbain).

  • Soutien à la conception axée sur les transports en commun.

  • Privilégier les immeubles de moyenne hauteur (urbanisme préindustriel) plutôt que les gratte-ciel (urbanisme moderniste).

  • Valoriser le patrimoine urbain.

  • Promotion du développement (ou réaménagement) des quartiers historiques des villes (en particulier ceux qui ont été abandonnés par l’industrie ou touchés par la pauvreté).

  • Soutien des pratiques de conception plus participatives, impliquant divers acteurs.

Même si les villes canadiennes ont continué à construire des banlieues à leurs abords, plusieurs initiatives visent maintenant à encourager le développement urbain en parallèle. De nombreuses administrations municipales reviennent sur les politiques de zonage régressives qu’elles appliquaient auparavant. Le consensus a tellement changé que le gouvernement fédéral a même proposé un financement direct aux municipalités qui prennent des mesures pour augmenter la densité urbaine.


À lire aussi :
Rue Wellington, Plaza Saint-Hubert… Qu’en est-il vraiment de la « coolitude » des rues défrayant les palmarès ?


Ces questions fondamentales relatives au développement à usage mixte s’accompagnent de détails de conception importants qui contribuent à rendre les villes agréables et à échelle humaine. Les développements modernistes de type « Tower on the Park » comprenaient souvent des pelouses avec des allées piétonnes. Cependant, ces installations piétonnes mettaient l’accent sur l’activité récréative de la marche à côté de l’herbe. En revanche, les projets de densification urbaine d’aujourd’hui sont plus axés sur le social, ce qui permet d’aller à pied ou vélo aux magasins, aux centres communautaires, aux écoles et à d’autres endroits pratiques. Les nouveaux aménagements placent à proximité des espaces communautaires et des espaces commerciaux, tels que des épiceries.

Vue aérienne sur une ville
Exemple typique des constructions « Tower on the Park », la coopérative Penn South (1962) à Manhattan comprend de nombreuses tours entourées d’une bande de terrain paysager afin que l’édifice ne donne pas directement sur la rue.
(Wikimedia)

Combler les lacunes des zones urbaines établies

Les coûts d’infrastructure liés à l’étalement urbain ont aussi aidé les municipalités à voir le potentiel de développement des terrains inutilisés ou sous-utilisés dans leur ville. Cependant, la planification et le développement de ce type de sites peuvent être plus complexes que ceux des terrains vierges en périphérie, précisément parce qu’ils se trouvent à l’intérieur des villes. Le site Molson a l’avantage d’avoir des bâtiments historiques, mais c’est aussi compliqué de repenser un endroit qui servait avant à des fins industrielles.


Déjà des milliers d’abonnés à l’infolettre de La Conversation. Et vous ? Abonnez-vous gratuitement à notre infolettre pour mieux comprendre les grands enjeux contemporains.


Le réaménagement des sites urbains peut entraîner des coûts, comme le temps et les dépenses nécessaires pour remédier à la contamination industrielle, les évaluations archéologiques, ou les consultations avec les parties prenantes concernées. Ces questions peuvent également impliquer des arrangements de gouvernance plus complexes, selon l’ancien propriétaire et les circonstances relatives aux droits fonciers.


À lire aussi :
Voici pourquoi certains quartiers favorisent la violence dans les relations amoureuses chez les ados


Bien que les sites intercalaires soient géographiquement proches des routes, des transports en commun et d’autres infrastructures existantes, les coûts d’infrastructure demeurent. S’agissant par exemple du projet Namur-Hippodrome à Montréal, les promoteurs se sont montrés réticents à construire les routes, égouts, et autres infrastructures nécessaires pour desservir le site, préférant que ces infrastructures soient fournies par le gouvernement. Cette situation nous rappelle qu’en fin de compte, les promoteurs sont des entreprises à but lucratif qui déterminent les coûts et les avantages des projets en fonction de leurs propres frais, et non en fonction d’objectifs sociaux.

Une plus grande mixité

Depuis plusieurs années, Montréal et d’autres villes tentent de créer une morphologie urbaine plus variée et attrayante, qui comprend un mélange de hauteurs de bâtiments, de destinations et de types de logements. Un mélange intriqué d’espaces publics et privés peut attirer des regards bienveillants au niveau de la rue, renforçant ainsi le sentiment de sécurité. Les nouveaux projets de Montréal se présentent tous comme dynamiques, animés et axés sur la communauté.

La création d’espaces sociaux vise à encourager les interactions sociales positives et à éviter les sentiments d’anonymat et de déconnexion par rapport aux activités quotidiennes. Le projet Molson prévoit un grand parc le long des rives du Saint-Laurent. Le projet Esplanade-Cartier a mis l’accent sur les équipements sociaux du projet, avec non seulement une rue piétonne, mais aussi une « maison du projet » avec un jardin communautaire sur le toit-terrasse. Bien que le jardinage sur les toits soit déjà bien développé à Montréal sur le plan commercial, ce projet s’annonce comme le premier jardin communautaire sur le toit d’un édifice privé au Québec.


À lire aussi :
La densification des villes est bonne pour l’environnement… et l’économie


Embrasser la complexité de la ville, c’est accepter la dimension sociale

Construire dans des villes déjà développées implique une certaine complexité. Le processus de consultation et de planification du projet Namur-Hippodrome à Montréal, qui a duré 10 ans, en est un exemple, mais pas un cas isolé. À quelques pas de la colline du Parlement, le réaménagement des plaines Lebreton à Ottawa est promis depuis des décennies. Le processus de développement du quartier résidentiel Ookwemin Minising dans les terrains portuaires de Toronto est pour sa part en cours depuis 2017.

Les nombreux projets de densification urbaine en cours à Montréal suggèrent une certaine reconnaissance du fait que le programme suburbain n’était pas suffisamment diversifié. Les projets actuels permettent de créer de nouveaux logements à proximité de corridors commerciaux dynamiques. Les ingrédients qui composent le concept de quartier 15 minutes (zonage à usage mixte qui permet des corridors commerciaux praticables à pied), ne sont pas nouveaux. Ce qui est peut-être nouveau, c’est le degré auquel les réseaux d’acteurs ont intégré les idées du Nouvel Urbanisme dans leurs pratiques de planification, de conception, et de construction. Les projets suggèrent qu’il existe désormais un nombre important de professionnels pour qui la notion de quartier a évolué.

La Conversation Canada

Christina Bouchard ne travaille pas, ne conseille pas, ne possède pas de parts, ne reçoit pas de fonds d’une organisation qui pourrait tirer profit de cet article, et n’a déclaré aucune autre affiliation que son organisme de recherche.

ref. Notre conception de ce qu’est un quartier a changé – https://theconversation.com/notre-conception-de-ce-quest-un-quartier-a-change-270760

Monográfico de Bienestar Digital: Retos y soluciones en la era de la hiperconexión

Source: The Conversation – (in Spanish) – By The Conversation España, Editor, The Conversation

Jacob Lund/Shutterstock

Descargue nuestro monográfico de 170 páginas dedicado al Bienestar digital

¿Por qué las chicas adolescentes se sienten peor que los chicos? Uno de cada tres niños usa el móvil en los restaurantes de comida rápida: ¿qué consecuencias tiene? Niños y grupos de WhatsApp: ¿cuándo y cómo?

Son algunos de los temas que hemos abordado a lo largo de los últimos 15 meses en torno a una temática que preocupa especialmente a la sociedad: el bienestar digital de los menores. A través de más de sesenta textos hemos funcionado como agregadores de conocimiento multidisciplinar sobre bienestar digital aportado por sociólogos, educadores, psicólogos, pediatras, legisladores, expertos en ciberseguridad, psiquiatras, lingüistas… Y como colofón, los hemos reunido en un monográfico que no tiene desperdicio.

Pasen y lean este compendio actualizado que esperamos que, como sociedad, nos ayude a optimizar nuestra relación con la tecnología de una manera crítica y responsable, aprovechando todo su potencial sin que eso implique una pérdida de nuestro bienestar.

The Conversation

ref. Monográfico de Bienestar Digital: Retos y soluciones en la era de la hiperconexión – https://theconversation.com/monografico-de-bienestar-digital-retos-y-soluciones-en-la-era-de-la-hiperconexion-278828

Gender conformity starts young – and boys and girls fall in line in different ways

Source: The Conversation – USA – By Adam Stanaland, Assistant Professor of Psychology, University of Richmond

The messages children receive about how to properly perform their gender carry into adulthood. Fotografia Basica/iStock via Getty Images Plus

Many people have felt the subtle pressure to be “man enough” or “woman enough” in the eyes of others. And research has shown this pressure can have personal and social consequences.

When men feel their manhood is challenged, they can respond with compensatory aggression and other harmful behaviors. When women step outside stereotypical femininity – or even just consider doing so – they often receive backlash.

As researchers who study how gender stereotypes and norms affect people in often unexpected ways, we wondered about the processes by which children feel motivated to conform to stereotypical gender norms. When does this start, and how might it manifest?

In recently published research we conducted with our colleague Andrei Cimpian, we found that when children perceive that their sense of being a “normal” or “proper” member of their gender group is threatened, they feel pushed to conform to stereotypical gender roles in different ways, with lasting consequences.

Two children in dresses sitting on curb on a neighborhood, skateboards before them
Children begin learning how to negotiate gender stereotypes and norms early on.
Petri Oeschger/Moment via Getty Images

Girl questions and boy questions

Borrowing from research on adults, we decided that the best way to assess children’s motivation to conform to gender norms was to challenge their status as a “typical” member of their gender group.

To do this, we asked 147 children ages 5 to 10 in New York City to play two games: a “Girl Questions Game” and a “Boy Questions Game.” Each featured difficult trivia about topics that are stereotypically gendered, such as “Which of these flowers is a poppy flower?” (Girl Questions Game) and “Which of these football teams was the 2016 champion?” (Boy Questions Game).

We randomly assigned children to receive feedback suggesting their performance was either gender-typical or gender-atypical, the latter of which was our version of a threat to their gender conformity. For example, a boy in this threat condition received feedback that he had aced the Girl Questions Game but flopped the Boy Questions Game.

Next, we assessed how they responded to this feedback. Would the boy publicly share or hide his achievement in a “Girl Questions Game Book of Winners”? Would he proudly wear a “Girl Questions Game Winner” sticker, or would he prefer to switch stickers? Would he be worried about what his peers would think?

Responding to gender conformity threats

We found three distinct ways children responded to threats to their gender conformity.

First, girls and boys of all ages were extra concerned about not fitting in with their gender group. This means they anticipated more rejection from their peers and reported lower self-esteem.

Second, certain children actively tried to demonstrate that they fit in with their gender group. Younger girls ratcheted up their femininity, while older boys ratcheted up their masculinity. For example, older boys would tell us they liked action figures more than dolls, or that they wanted to retry the Boy Questions Game over the Girl Questions Game.

This is in line with previous research showing that many young girls are immersed in “princess culture” and are especially motivated to prove their femininity, though this declines with age. In contrast, older boys increasingly learn as they age that masculinity is a precarious social status that is hard-won and must be actively proven.

Third, boys of all ages avoided seeming atypical from their gender group, actively distancing themselves from anything feminine. We didn’t see girls distancing themselves from anything masculine in the same way.

This response mirrors a cultural double standard in the U.S.: Girls are often encouraged to be athletic, assertive or like “tomboys,” while boys face no socially acceptable equivalent in the other direction. There is no benign male version of tomboy. The closest word is “sissy,” which is not typically considered a compliment.

Child wearing pink butterfly wings and holding a wand in a forested area
Boys are often not given much leeway to express their femininity.
Maskot/Getty Images

Building secure gender identities

Our findings show that the seeds of adult gender conformity – including some of its most harmful expressions, such as certain men’s aggression and some women’s anxiety around pursuing careers in male-dominated fields – are planted early.

Boys as young as 5 already recognize that femininity is something to avoid. By middle childhood – around age 7 – they seem to understand that masculinity is a status that must be actively proven and defended, a mindset that can manifest as aggression, sexual violence and resistance to seeking help in adulthood.

For girls, our findings suggest that they are motivated to prove stereotypical femininity at younger ages, but this may dissipate with age. This may be because girls are sometimes encouraged to pursue achievement in historically “masculine” domains, such as sports and in STEM. Or they may realize that masculinity affords men – and boys – success in these fields, so they seek to move away from femininity and toward masculinity.

However, it’s possible that girls in other settings are more pressured to perform femininity and avoid masculinity – that is, to engage in feminine stereotypes – in ways we were not able to capture in our study. It’s also unclear to us why girls’ responses to perceived threats to gender conformity may weaken with age, given that adult women are affected by these threats. Our future goal is to further test how gender conformity develops in more diverse geographic and cultural contexts, as well as among more gender-diverse children.

All said, we believe middle childhood may thus present a critical window for intervention. Programs that help children, especially boys, build secure identities that don’t depend on gender performance could help them have a healthier relationship with gender norms. In this way, children may be less vulnerable to responding to perceived threats to their gender conformity in ways that harm them through adulthood.

Nevertheless, what’s clear is that children don’t simply observe gender norms – they internalize them, actively defend them, and begin to do this earlier than people think.

The Conversation

The authors do not work for, consult, own shares in or receive funding from any company or organization that would benefit from this article, and have disclosed no relevant affiliations beyond their academic appointment.

ref. Gender conformity starts young – and boys and girls fall in line in different ways – https://theconversation.com/gender-conformity-starts-young-and-boys-and-girls-fall-in-line-in-different-ways-275996

Information is a battlefield: 4 questions you can ask to judge the reliability of news reports and social posts about the US-Iran war

Source: The Conversation – USA – By Andrea Hickerson, Dean and Professor, School of Journalism and New Media, University of Mississippi

Staff members watch as Defense Secretary Pete Hegseth speaks during a press briefing at the Pentagon on March 2, 2026. AP Photo/Mark Schiefelbein

Historically, when the U.S. has undertaken military action against foreign governments, journalists have relied heavily on government sources and rallied “’round the flag,” often uncritically sharing official narratives about U.S involvement. This has been evident during periods of U.S. military engagements in Vietnam, Iraq and Afghanistan.

Recently, however, the Pentagon has restricted access for legacy news organizations. And on March 14, 2026, Brendan Carr, chairman of the Federal Communications Commission, replied to a social media post from President Donald Trump complaining about reporting on U.S. involvement in Iran. Carr threatened to deny license renewals to broadcasters not operating in the “public interest.”

“The People of our Country understand what is happening far better than the Fake News Media!” Trump asserted in his original Truth Social post.

This hostile relationship between journalists and a presidential administration is only part of the story about what is or isn’t happening on the ground in Iran and the Middle East.

In times of conflict, information about military activity can be seen as another domain of conflict, much like air, land and sea. Countries, including Iran, have long tried to manipulate information to persuade or influence what people think outside the region.

A preprint, not yet peer-reviewed study authored by academics affiliated with the U.S. Air Force and the U.S. Air Force Academy describes increased government funding and attention to “cognitive warfare,” or efforts to influence what people think through strategic messaging.

A common call to action from advocacy and educational groups in politicized situations where misinformation weighs heavy is to teach media literacy. Conventional wisdom holds that if people only knew how to read the news and look for bias, they would understand a situation more clearly.

As a journalism scholar and educator, I agree that media literacy is valuable. But it’s also time-consuming. It’s impractical to complete a full training or curriculum when faced with immediate current events. As an abbreviated measure to assess the current Middle East conflict, readers can start with the premise that information is contested and an extension of the battlefield.

Key questions to ask

This assumption reframes news not as something that finds a reader by chance, but as something someone wants a reader to see. It primes readers’ critical thinking.

Then readers can consider some key questions:

Why does the author of this information want me to see this?

The obvious answer is that they think it’s important, but what are they focused on? Military progress? One actor in the conflict? Civilian responses? Public opinion? Diplomacy? Asking these questions helps assess what is left out and helps readers resist the temptation to extrapolate details they can’t know from a single news story.

What information does this person or organization have access to?

Because Iran is inaccessible to many journalists, readers must be especially careful about reporting purporting to know or show what is going on inside Iran. For sure, information is coming out via citizen reports and social media, but it is hard to verify and interpret.

An aerial view of dozens of graves.
Graves dug for coffins of students killed in a bombing on a girls elementary school in Minab, Iran, are seen during a mass funeral on March 3, 2026.
Stringer/Anadolu via Getty Images

Relatedly, and especially when consuming content from social media, readers can ask:

What about an author’s personal experience may inform their interpretation of events?

Media produced for and by diasporas – people displaced from their country of origin by choice or force – is a good source for contextualized and expert information about conflicts in their country of origin. But diasporas can also be deeply political and strategic in what they share. As a general consumer, readers don’t need to get to the bottom of the veracity of the information they share. Readers can simply be aware of disaporas’ positions so they can factor this into their interpretation and understanding of the conflict.

What do different people or organizations have to gain or lose by people widely seeing specific information?

If information is a battlefield, actors will make strategic choices in what they will share with the public. Sometimes they will shield information from the public or deny information. However, undesirable and unflattering information occasionally gets out and circulated, as was the case when a missile struck an Iranian elementary school.

Politicians will want to show they are winning. Journalists may want to show they are being a watchdog on the government. Readers can consider the goals of both the authors and the sources they cite when trying to orient themselves around the information they share.

Transparent fact-checking

Beyond media literacy, there are several potential short cuts to finding accurate information about immediate events in Iran.

First, readers can look for opinions and commentary from established experts on the Middle East, Iran, oil, the military and other related fields. Too many readers claim expertise after reading a few popular articles or listening to a podcast.

Instead, they can look for people who have been observing and researching the region for years – people whose work has been already validated by peer review. As a starting place, readers can look for subject matter experts on the social network LinkedIn or search for research on Google Scholar. Readers can also see whether authors of older popular books are writing about contemporary events on websites or blogs.

Cars drive by a building with a picture of a U.S. flag and air carrier on it.
Vehicles pass a billboard in Tehran, Iran, on Feb. 22, 2026, depicting a U.S. aircraft carrier with damaged fighter jets on its deck.
AP Photo/Vahid Salemi

Think tanks that produce research reports may also be helpful, but sometimes think tanks with neutral-sounding names are politically affiliated. A close read of the “About Us” page and perusing the list of funders can offer some helpful clues.

Finally, perhaps the most efficient way to evaluate what is happening in Iran is to follow fact-checking and open-source reporting organizations. These groups often do a better job showing their assessment work and linking to evidence than do traditional news outlets, which focus on narrative structure and a cohesive final product.

Poynter, a nonprofit journalism institute, recently detailed the work of Factnameh, run by an Iranian fact-checker in exile. Bellingcat and Indicator are two excellent open-source reporting organizations that use public data to investigate whether actual events match circulating narratives.

And sometimes traditional news organizations do similar types of investigations, such as this example of The Associated Press debunking video misinformation in Iran.

The transparent methods of fact-checking and open-source sites can also serve as interactive exercises in media literacy. Both Bellingcat and Indicator regularly showcase information validation tools that readers can use.

Regardless of how much effort readers choose to spend on evaluating the accuracy of reporting on Iran, none of us are watching the battle from the sidelines.

The Conversation

Andrea Hickerson does not work for, consult, own shares in or receive funding from any company or organization that would benefit from this article, and has disclosed no relevant affiliations beyond their academic appointment.

ref. Information is a battlefield: 4 questions you can ask to judge the reliability of news reports and social posts about the US-Iran war – https://theconversation.com/information-is-a-battlefield-4-questions-you-can-ask-to-judge-the-reliability-of-news-reports-and-social-posts-about-the-us-iran-war-278384

Health insurance jargon can be frustrating and confusing – here’s how to navigate it

Source: The Conversation – USA (3) – By Jamie Hartmann-Boyce, Assistant Professor of Health Promotion and Policy, UMass Amherst

Sorting through the nuances of copays, deductibles, premiums and other jargon can be frustrating. Tfilm/Moment via Getty Images

Since the Affordable Care Act subsidies expired at the end of 2025, Americans have undoubtedly been encountering a great deal of confusing information surrounding health care costs and insurance plans.

From five-figure deductibles to premiums higher than people’s mortgages, costs are rising across the board.

With this comes difficult decisions around health care plan enrollment. No one can know exactly what their health care needs will be in any given year, so people are forced to hedge their bets in choosing plans.

What plan you pick has a huge impact on what you will end up paying.

However, many Americans don’t understand key health insurance terms. For example, people who’ve completed fewer levels of education and people without health insurance are less likely to understand the jargon. This can get in the way of picking the right plans.

As scholars of health policy, evidence-based health care and health economics, we believe understanding these terms can help you pick what plan might be the best for you.

Frequently encountered health insurance terms

The first of these is your health insurance premium. This is the amount you pay each month for having health insurance coverage, whether or not you use any services. Premiums can be expensive, but they are predictable. Once your premium is set for the year, it won’t change.

What’s much harder to predict is how much of each medical bill you will have to pay yourself, known as out-of-pocket costs. These are sometimes also referred as “patient cost-sharing” or “copays.” These typically come in three forms: deductibles, coinsurance and copayments.

A deductible is how much you need to spend on your health care in a given year before your insurance starts covering any costs. Under plans with a deductible, you pay the full cost of health care services first – essentially as if you did not have health insurance – until your total spending reaches the deductible amount. Once you reach that threshold, your insurance will start paying for your additional medical costs.

But in most plans, even once you hit your deductible, your insurance will still not cover the full cost of your care. You will continue to pay a portion of the bill through coinsurance, which is the percentage of the cost of care that you are responsible for paying. For example, if your coinsurance rate is 20% and you receive care that costs US$500, you would pay $100 (20% of $500).

What often makes coinsurance confusing is that while the coinsurance rate – the percentage – is usually listed on your health insurance card, you still need to know the total cost of your care to calculate how much you will owe. That cost is difficult to know in advance because reliable health care prices are difficult to find and health care needs – and the services required to treat them – can be unpredictable.

Insurance claim form concept
Reliable up-front health care pricing is difficult to find.
teekid/E+ via Getty Images

Then there are copayments. This is a fixed amount you pay for a health care encounter, such as $20 for a primary care visit or $150 for an emergency department visit. In everyday language, people sometimes use copay to refer to any amount a patient pays out of pocket. Technically, however, a copayment refers only to a fixed fee paid for a health care service.

Whether through deductibles, coinsurance or copayments, these out-of-pocket amounts can add up quickly. To protect patients, especially those who need a lot of care and could otherwise face devastating medical bills, federal regulations require health insurers to limit how much patients can be asked to pay out of pocket each year for covered services.

This amount is called the out-of-pocket maximum. This is sometimes also called the out-of-pocket cap or out-of-pocket limit. Once your total out-of-pocket spending reaches that limit, your insurance must pay 100% of the cost of additional covered services for the rest of the year.

Additional factors to consider

These insurance rules can become even more complicated. Many plans have multiple different deductible amounts, coinsurance rates, copayments and even out-of-pocket maximums, depending on several factors. For example, in family plans, each person may have their own deductible or out-of-pocket maximum, but there may also be thresholds and limits that apply to the family as a whole. Cost-sharing can also vary by the type of care you receive. For instance, inpatient hospital care may be subject to a different set of cost-sharing rules than outpatient care.

Another important factor is whether your health care provider has a contract with your insurance company. Providers who have such a contract are called in-network providers. Those who do not are called out-of-network providers. Some insurance plans further divide in-network providers into tiers.

Providers in Tier 1 are the most preferred by the insurance plan, often because they agreed to provide services at relatively lower prices. Other in-network providers may be placed in Tier 2. Costs to you tend to be lowest for services from Tier 1 providers, higher for services from Tier 2 providers and highest for services from out-of-network providers. Some insurance plans may not cover out-of-network care at all.

There are often trade-offs between these elements – low premiums look great on the face of it, but any money you save by paying lower premiums is often offset by significant out-of-pocket costs, limited options for in-network providers, or both.

The problem, of course, is that it’s impossible to predict how much health care you might need. If you could somehow know you weren’t going to need much health care in the following year, then a low-premium, high-deductible plan would make sense.

If, on the other hand, you knew you were going to receive a catastrophic diagnosis or be in a life-altering car accident, you would want to opt for a plan that might include higher premiums but lower copays.

Gambles and trade-offs

If everyone knew all the medical care they needed could be provided by any general doctor, they might not care much about what or who was in-network. But if they knew they were going to need specialist surgery for a rare type of tumor, for example, offered at only one center out of state, they would want to consider what counts as in-network – or the costs of going out of network – in substantially more detail.

In many other countries, people don’t face the same burden. In nations with universal health coverage, understanding health insurance jargon isn’t a matter of financial survival. Because coverage is guaranteed, people do not have to agonize every year over choosing a health plan based on countless variables.

But until meaningful change comes about in the U.S., the best many Americans can do is understand health insurance jargon so they can choose plans that work best for them.


The Conversation

Jamie Hartmann-Boyce receives research funding from the National Institutes of Health, the Food and Drug Administration, the Truth Initiative, and Cancer Research UK.

Michal Horný consults to VBID Health. He receives funding from Arnold Ventures and the National Institutes of Health. He received speaker honoraria and/or travel support from Health Care Cost Institute, Georgetown University, Brown University, Charles University (Czech Republic), Masaryk University (Czech Republic), and the Czech Academy of Sciences (Czech Republic).

ref. Health insurance jargon can be frustrating and confusing – here’s how to navigate it – https://theconversation.com/health-insurance-jargon-can-be-frustrating-and-confusing-heres-how-to-navigate-it-277355

Seattle tried to guarantee higher pay for delivery drivers – here’s why it didn’t work as intended

Source: The Conversation – USA (2) – By Andrew Garin, Associate Professor of Economics, Carnegie Mellon University

Boosting pay for food delivery drivers is proving hard to pull off. Kevin Carter/Getty Images

If you’ve ever ordered food through DoorDash, Uber Eats or Instacart, you may have realized the person who delivers it isn’t a salaried employee. They’re gig workers – independent contractors who pick up delivery tasks through an app, get paid per delivery and have no guaranteed hours, benefits or minimum wage protections.

Policymakers in several cities have tried to change that.

Seattle is a good example. In January 2024, the city implemented a law requiring delivery apps to pay drivers a minimum rate for each task: a combination of per-minute and per-mile minimum compensation that set a floor of US$5 per delivery.

The goal was straightforward: ensure that the people bringing you your lunch earn a decent living.

We are labor economists who have extensively studied the emergence of the gig economy and previous policy efforts designed to provide economic security to workers in unstable employment situations. We wanted to know how new gig economy regulations like the one in Seattle were playing out in practice.

When we studied what happened to delivery drivers’ earnings after Seattle’s payment rule took effect, we found that despite base pay per delivery roughly doubling, their total monthly earnings barely changed. That’s because competition among drivers for delivery tasks intensified while customers made fewer orders and tipped less on each order in the aftermath. Those effects combined washed out almost all of the intended gains.

No change in monthly earnings

To understand the policy’s effects, we used detailed data from Gridwise, an app that gig workers use to track their earnings across multiple delivery and ride-sharing platforms. This gave us an unusually complete view of how much the drivers were earning across all of the apps and platforms they were using.

We compared what happened to the earnings of drivers who were primarily working in Seattle before the law took effect with the earning of drivers working in other parts of Washington state, where nothing had changed. By tracking both groups over the months before and after the policy, we isolated the policy’s impact from broader trends affecting all drivers.

Base pay per delivery in Seattle jumped from about $5 to over $12, as intended. But base pay is only part of the picture. Tips typically make up most of a platform delivery driver’s income, since customers generally tip 10% to 20% of the cost of their meals.

After the law took effect, tips fell sharply. Delivery apps passed higher costs on to consumers through new fees. DoorDash added a roughly $5 “regulatory response fee” to Seattle orders, and customers responded by tipping less.

Some platforms went further: Uber Eats removed the option for Seattle customers to tip at checkout. The drop in tips offset more than one-third of the base pay increase.

The other major change was that drivers started completing fewer deliveries.

Beginning in the second month after the policy took effect, Seattle drivers who had been consistently active on the apps prior to the change completed roughly 20% to 30% fewer monthly deliveries than they would have without the policy.

Importantly, these drivers didn’t leave the apps. They were still logging on and spending about the same amount of time working. They just weren’t getting as many delivery offers.

What were drivers doing with all that extra time on the app? Our data shows they were spending more of it waiting.

The share of on-app time spent actually performing paid deliveries fell substantially. Wait times between tasks increased by about five minutes, nearly doubling from pre-policy levels. And drivers went farther between deliveries – suggesting they were actively cruising toward restaurant-dense areas to find their next task, burning more gas without being paid for those extra miles they were logging.

Put those pieces together – higher pay per delivery, but fewer deliveries and lower tips – and they almost exactly cancel out. After a brief bump in the first month, monthly earnings returned to pre-policy levels.

Why gig markets are different

To understand why this happened, it helps to think about how gig delivery markets differ from traditional employment.

In a conventional job, raising the minimum wage creates a clear divide: Workers who keep their jobs earn more, while others may struggle to find work if their employers cut jobs.

But in gig delivery, there’s no such divide. There’s no hiring or firing involved; anyone can download the app and start looking for work. Delivery tasks are distributed among everyone who is online, and there’s no sharp boundary between having a job and not having one.

When what drivers get paid per delivery rises, gig work becomes more attractive, drawing new drivers into the market. Meanwhile, higher costs to pay drivers are passed along to consumers through increased delivery prices, which can lead to fewer orders and lower tips. More drivers chasing fewer deliveries means longer waits for tasks.

This process continues until the higher pay per task is fully offset by the longer gaps between paid work.

Our data confirms this pattern.

While deliveries by existing drivers fell sharply in Seattle, new entrants arrived. Within three months, newcomers were doing most of Seattle’s deliveries.

A food delivery gig worker holds up his smartphone with a food delivery order. The phone displays the information in Spanish.
A food delivery driver displays a food order on his phone that would earn him $3.52 for a 23-minute ride, not counting a return trip.
Craig F. Walker/The Boston Globe via Getty Images

What this means going forward

To be sure, gig workers’ low pay is a real problem. The impulse behind Seattle’s law reflects legitimate concerns.

But our findings do suggest that efforts to directly regulate what gig workers earn per task they complete won’t easily fix that problem.

As long as anyone can join the platform and start competing for deliveries, the guarantee of higher pay per task will attract more drivers until the benefit is competed away through longer wait times.

Other cities and states are choosing this route

Actually raising earnings might require limiting the number of active drivers – something like the taxi medallion systems some cities once used to ensure high driver pay.

But entry barriers undermine the flexibility that draws many people to gig work in the first place. And platform behavior matters too: If apps eventually restore normal tipping features rather than strategically discouraging tips, which New York City and some other jurisdictions are now requiring, the picture for drivers could improve somewhat.

A big group of delivery workers people seen on a street with their motorcycles.
Delivery drivers await orders in the Queens borough of New York City.
Lindsey Nicholson/UCG/Universal Images Group via Getty Images

Still, there may not be a solution that preserves all the benefits of the current system while also guaranteeing higher pay.

Nevertheless, several cities across the country are considering similar regulations.

New York City implemented its own minimum pay rate for delivery workers in late 2023. City councils and state lawmakers in Chicago, Colorado, Minnesota and elsewhere have proposed similar protections.

Seattle’s experience suggests all cities should proceed with caution and be aware of the limits of what per-task pay regulations can achieve when the door is always open to new workers.

The Conversation

To purchase access to the data used in this study Brian K. Kovak received funding from the Block Center for Technology and Society at Carnegie Mellon University.

ref. Seattle tried to guarantee higher pay for delivery drivers – here’s why it didn’t work as intended – https://theconversation.com/seattle-tried-to-guarantee-higher-pay-for-delivery-drivers-heres-why-it-didnt-work-as-intended-276576

Moral metrics: Are corporate algorithms becoming our new moral authorities?

Source: The Conversation – USA (3) – By Beth DuFault, Assistant Professor of Marketing, University of Portland

Scores help give us a sense of how we’re doing – but they’re not always neutral. Dilok Klaisataporn/iStock via Getty Images Plus

You check your credit score before applying for an apartment. Your fitness watch tells you whether you slept well enough. A workplace dashboard measures your productivity. Parents can buy devices that track their baby’s breathing and heart rate while they sleep.

Increasingly, numbers tell us how we are doing.

These systems promise something appealing: clear feedback about whether we are behaving well. They appear objective, neutral and data-driven. But they also signal a deeper cultural shift, as algorithms define what counts as virtuous behavior.

In other words, we are living in a world where metrics are being translated into moral judgments. As a researcher who has long studied how markets and technologies shape moral responsibility, I’ve seen how these metrics quietly reshape how people understand themselves and how other people judge them.

Defining the good life

For generations, religious congregations structured everyday life for many people, offering templates for identity and for what a “worthy” life should look like.

As societies grow more diverse, however, and as fewer people affiliate with formal religious groups, faiths’ moral influence on society is waning. With their authority no longer taken for granted, some religious groups market themselves almost like brands: lifestyle choices that one can choose to follow or ignore.

People start to assemble their own sense of right or wrong from a patchwork of sources – and increasingly, that involves for-profit scores, rankings and dashboards.

Credit scoring offers a clear example of how this works. A credit score seems like an objective measure of financial worthiness.

But the actions required to optimize a score define what worthy financial behavior looks like in U.S. society today. It’s not just about paying bills on time. Achieving an optimum credit score most often involves having at least one credit card; keeping a low debt-to-credit ratio, which might involve requesting credit limit increases instead of paying down debt; not canceling any credit cards so that average account length is maximized; and having the “right” credit mix, which often includes a consumer loan. Today, a consumer with no credit cards – something that at one time might have seemed financially virtuous – doesn’t develop the kind of “file” that is readily rewarded with a high score, and they might not be able to obtain credit to buy a house or a car.

In our work on consumer credit scoring, consumer culture researcher John Schouten and I found that people often incorporate their credit scores into their sense of identity and narrative about their life, interpreting scores as reflections of their character and morality. A high score feels like a sign of virtue. A low score can trigger feelings of shame or failure and a determination to be better.

One consumer described discovering her credit score for the first time as finding out what kind of person she actually was. Another, working to rebuild his score after a medical debt caused a cascade of defaults, related that he checked it every morning, to see if he was someone people could trust again.

Moral mirrors

Credit scoring is only one example. Health apps convert exercise, sleep and heart rate into performance indicators. Workplace platforms turn everyday tasks into dashboards, rankings and streaks. Reputation systems rate drivers, sellers and freelancers, often with a single number that stands in for trustworthiness.

Even parenting, one of the most emotional human roles, is touched by this logic. Wearable infant monitors translate babies’ breathing, oxygen levels and sleep patterns into charts, alerts and “insights.” These technologies are marketed as tools for reassurance, but in a 2026 paper, my co-authors and I found that these tools also nudge expectations.

Parents describe feeling that if a device exists that can watch a baby’s breathing all night, then a truly responsible caregiver must use it. “All the parents in our social group have one breathing monitor or another,” one dad said. “My boss has one. If I could prevent something horrible by spending a little money and watching the monitors, and I didn’t, what kind of parent would I be?”

An Asian man in a gray sweatshirt smiles at a baby as he holds a phone.
Apps don’t just record behavior; they shape it.
Oscar Wong/Moment via Getty Images

The emotional weight of that shift is striking. One mother said that she felt guilty on the nights she forgot to charge the device – not because anything had gone wrong, but because she had failed to be watchful in the way the market now defines good parenting. Another said simply, “If something happened and I didn’t have it on, I don’t know how I could live with myself.” The monitor had become less a tool than a test.

Measurement can be genuinely useful. When scores appear precise and impersonal, they can feel more solid than the messy, subjective judgments we make in everyday life. But as historian Jerry Muller lays out in “The Tyranny of Metrics,” scoring systems subtly embed assumptions about what responsible behavior looks like, then reflect those assumptions back to us as if they were simple facts. A high credit score begins to look like proof of moral worthiness. A steady stream of productive hours on a work dashboard looks like evidence of commitment.

As these metrics spread, they start to stitch together a new, data-driven sense of what it means to be a good person. This shows up in ordinary decisions: choosing a loan because it will help your score; taking your phone on a run so it “counts” toward your fitness goals; waking in the night to check a baby only because the app suggests you should. The line between caring for others and optimizing for a number becomes easy to blur.

Into the void

For centuries, religious traditions, philosophers and moral communities have wrestled with what it means to live a good and virtuous life. Algorithmic scoring systems do not claim to answer those questions, but as traditional forms of moral authority weaken among many Americans, I would argue that algorithmic systems are moving into the void.

They do not claim to answer questions about the soul, but they do offer something that can feel almost as reassuring: clear indicators of whether you’re on the right track. A high score, a green check mark, a completed streak – these are small, everyday reassurances that we are, in some sense, measuring up.

The deeper question is how comfortable society is letting these systems become our go-to mirrors for moral self-assessment. Instinctively looking to a number to tell whether someone is doing well as a borrower, worker, patient or parent risks forgetting that numbers can only capture a thin slice of what it means to be a good human being.

Many of these scoring systems are built by for-profit companies with a specific interest in the outcome. They are not designed simply to measure behavior; they are designed to shape it, nudging consumers to continuously improve their scores in ways that make them more valuable, more legible and more profitable to the companies doing the measuring. The goal is not necessarily for you to flourish; it’s for your behavior to benefit corporations.

The next time you check your rating or a ranking and feel a small surge of pride or unease, it may be worth pausing to ask: Whose idea of “good” am I seeing reflected there, and is it really the one I want to live by?

The Conversation

Beth DuFault does not work for, consult, own shares in or receive funding from any company or organization that would benefit from this article, and has disclosed no relevant affiliations beyond their academic appointment.

ref. Moral metrics: Are corporate algorithms becoming our new moral authorities? – https://theconversation.com/moral-metrics-are-corporate-algorithms-becoming-our-new-moral-authorities-273178

Les avantages et risques du nouveau régime d’exonération tarifaire de la Chine pour l’Afrique

Source: The Conversation – in French – By Lauren Johnston, Associate Professor, China Studies Centre, University of Sydney

Le président chinois Xi Jinping a annoncé, en février 2026, qu’à compter du 1er mai, la Chine va supprimer les droits de douane pour 53 pays africains. Il s’agit de tous les pays du continent à l’exception de l’Eswatini, qui reconnaît Taïwan.

Les échanges commerciaux entre la Chine et l’Afrique ont atteint 348 milliards de dollars américains en 2025, soit une hausse de 17,7 % par rapport à 2024. Les exportations chinoises vers l’Afrique dominent les flux commerciaux et se sont élevées à 225 milliards de dollars américains, soit une augmentation de 25,8 %.
Ce chiffre est à comparer aux 123 milliards de dollars d’importations en provenance d’Afrique, qui n’ont augmenté que de 5,4 %. Un tel déficit commercial croissant entre l’Afrique et son plus grand partenaire commercial souverain rend urgentes les nouvelles mesures chinoises en faveur des exportations africaines vers la Chine.

Au-delà du commerce et de la diplomatie, que signifie ce changement dans un contexte de rivalité commerciale entre grandes puissances ?

En me basant sur des années de recherche sur les relations commerciales sino-africaines, j’identifie deux effets probables positif et négatif.

D’abord, du côté positif, la suppression des droits de douane pourrait encourager la coopération transfrontalière en matière d’exportation au sein de l’Afrique. Du côté négatif, cela risque de profiter beaucoup plus aux économies africaines les plus fortes au détriment des économies plus faibles.

Le régime actuel

Les préférences commerciales de la Chine spécifiques à l’Afrique ont évolué grâce au Forum sur la coopération sino-africaine, créé en 2000. L’intégration de la Chine dans le commerce mondial depuis son adhésion à l’Organisation mondiale du commerce en 2001 a également évolué.

Depuis 2005, les pays les moins avancés d’Afrique bénéficient d’un accès sans droits de douanes à la Chine pour toutes les lignes tarifaires. Les pays les moins avancés sont des pays à faible revenu confrontés à de graves obstacles structurels au développement durable. Ils sont très vulnérables aux chocs économiques et environnementaux et disposent d’un faible capital humain.

Il y a 33 pays africains qui profitaient de ce régime. Les pays africains à revenu intermédiaire en étaient exclus. Ce chiffre est susceptible de changer en fonction de la croissance des revenus et de la reconnaissance diplomatique de Pékin.

L’Afrique du Sud, par exemple, a continué à être soumise à des droits de douane sur la plupart de ses exportations, notamment les fruits, le vin et les produits alimentaires transformés. Beaucoup se situaient entre 10 % et 25 %.

Seuls quelques articles de recherche se sont penchés sur les préférences commerciales chinoises antérieures envers l’Afrique. Par exemple, le chercheur en politiques publiques et économiste Adam Minson a estimé que les accords d’exonération tarifaire pour les pays les moins avancés de 2005 n’apporteraient à certains pays qu’à peine 100 000 dollars supplémentaires par an.

Ma propre thèse de doctorat a montré qu’en 2009, ces politiques commerciales préférentielles n’avaient eu aucun impact significatif sur les exportations. Plus récemment, les économistes Zhina Sun et Ehizuelen Michael Mitchell Omoruyi ont constaté que la politique actuelle de droits de douane nuls avait favorisé la diversification des exportations manufacturières vers la Chine et du commerce régional. Mais cela n’a eu que peu d’effets sur la diversification des exportations agricoles et minières.

Une recommandation revenait souvent dans les analyses: étendre le traitement tarifaire égalitaire à l’ensemble des blocs régionaux africains. Il s’agit notamment de la Communauté de l’Afrique de l’Est, de l’Union douanière d’Afrique australe et de la Communauté économique des États de l’Afrique de l’Ouest.

Cela pourrait conduire à une organisation régionale de la production destinée à l’exportation, plutôt que de la voir faussée, voire entravée, par des écarts tarifaires.

Les réformes annoncées par Xi en février constituent un pas dans cette direction.

Une incitation à coopérer ?

En étendant les droits de douane nuls à presque tous les pays africains, la Chine a supprimé une distorsion de sa politique tarifaire antérieure. Lorsque seuls certains pays bénéficiaient d’avantages d’exportation en franchise de droits, les investisseurs et les producteurs étaient incités à implanter leur production destinée à l’exportation dans les pays les moins avancés afin de s’assurer un accès à ces franchises douanières.

Cela ne fonctionnait pas toujours. En effet, les pays les moins avancés ont du mal à devenir des exportateurs car ils sont confrontés à des barrières commerciales comme l’approvisionnement en électricité peu fiable et des infrastructures déficientes.

La suppression totale des tarifs désavantagera les pays les moins avancés, car ils perdront le « statut spécial » qui leur était accordé sous l’ancien régime. Mais ce changement pourrait ouvrir de nouvelles perspectives. Les décisions de production peuvent désormais tirer parti des chaînes d’approvisionnement transnationales et intrarégionales existantes et potentielles, fondées sur l’avantage comparatif, au lieu de se concentrer sur les endroits où les droits de douane à l’exportation étaient les plus bas.

De plus, la baisse des droits de douane pour les économies africaines plus développées pourrait permettre aux entrepreneurs africains de travailler au-delà des frontières pour se livrer au commerce sans se heurter à des barrières commerciales différentes selon les localités. Cela pourrait à son tour soutenir le programme d’intégration commerciale de l’Afrique.

Pour stimuler le commerce, la Chine a également signalé qu’elle étendrait ses mesures de facilitation des échanges. Cela inclut des « voies vertes » améliorées pour les importations africaines. Voici quelques exemples potentiels :

  • un dédouanement plus rapide

  • des procédures phytosanitaires simplifiées (règles régissant la sécurité alimentaire). On pourrait par exemple établir un ensemble clair de critères permettant à un exportateur agréé, par exemple d’avocats kenyans, de bénéficier d’une pré-autorisation pour le dédouanement.

  • des investissements accrus dans la formation et la logistique liée au commerce.

La Chine a également mis en place un centre dédié à la facilitation des échanges Chine-Afrique à Changsha, la capitale de la province du Hunan. L’objectif est de disposer d’un pôle central d’expertise et d’industries liées au commerce, facilitant ainsi les échanges commerciaux entre les entreprises africaines et chinoises.

Le risque d’une répartition inégale des bénéfices

Le nouveau régime tarifaire risque d’entraîner une concentration de la production destinée à l’exportation dans les pays plus développés, tels que l’Afrique du Sud, le Maroc et le Kenya. Ces économies sont mieux placées pour développer leurs exportations lorsque ce régime entrera en vigueur.

En revanche, les pays les moins avancés continueront à faire face à des difficultés pour :

  • construire des infrastructures commerciales efficaces telles que les télécommunications, l’électricité et la connectivité portuaire

  • produire à l’échelle de l’exportation

  • respecter les normes commerciales, telles que les tailles requises pour les fruits et l’uniformité de leur couleur.

Le changement de politique de la Chine invite les nouveaux exportateurs africains vers la Chine à mettre en place des chaînes d’approvisionnement liées au commerce au-delà des frontières africaines afin d’acquérir l’échelle et la compétitivité nécessaires pour développer leurs propres exportations – bientôt exemptes de droits de douane – vers la Chine. Cela permettrait en retour de réduire la pression sur les pays les moins avancés, qui n’auraient plus besoin d’exporter directement vers la Chine. Ils n’auraient plus qu’à rejoindre les chaînes d’approvisionnement commerciales régionales.

Idéalement, au sein des sous-régions africaines, cela pourrait se transformer en une nouvelle incitation à créer des chaînes de valeur liées au commerce.

Le potentiel d’égalisation

Les réformes tarifaires du 1er mai constituent une avancée positive en supprimant les barrières tarifaires formelles à un moment où les droits de douane augmentent, sous l’impulsion des États-Unis. Ce changement simplifie les incitations et élimine les asymétries structurelles du régime commercial de la Chine avec l’Afrique.

Les droits de douane constituent toutefois rarement le principal obstacle à la transformation industrielle et aux espoirs d’exportation de l’Afrique. De surcroît, l’incertitude complique l’environnement commercial mondial.

Néanmoins, ces réformes constituent un pas en avant vers la promotion des chaînes d’approvisionnement sous-régionales si les pays africains coordonnent leurs stratégies de production.

The Conversation

Lauren Johnston est affiliée à l’AustChina Institute et à l’Institut sud-africain des affaires internationales.

ref. Les avantages et risques du nouveau régime d’exonération tarifaire de la Chine pour l’Afrique – https://theconversation.com/les-avantages-et-risques-du-nouveau-regime-dexoneration-tarifaire-de-la-chine-pour-lafrique-278435