Would a $1 rideshare fee affect wealthier or working-class Philadelphians more? 2 Chicago studies offer some perspective

Source: The Conversation – USA (2) – By Parth Vaishnav, Assistant Research Professor of Engineering and Public Policy, Carnegie Mellon University

Riders will pay about $30 per hour in time saved when deciding between using a ride-hailing app or public transportation, one study found. Michele Pevide/E+ Collection via Getty Images

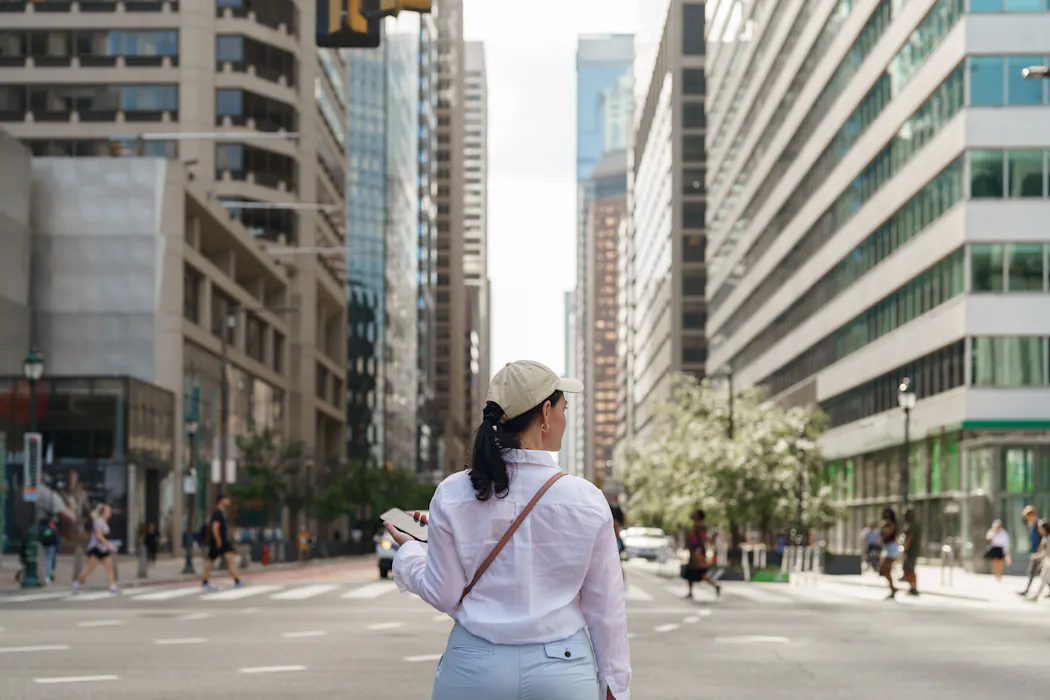
Philadelphia Mayor Cherelle Parker has proposed a US$1 fee on all Uber, Lyft and other rideshare trips in the city to begin in 2027. The projected $48 million annual revenue would go entirely to support the chronically underfunded Philadelphia school district, which faces a $300 million budget deficit.

Critics, including Uber, claim the tax will disproportionately hurt working-class riders.

Parker argues that the tax will be applied to the rideshare companies: The companies can choose not to pass them on to riders.

We are a professor and a Ph.D. candidate who research the benefits and costs of green technologies and policies. In 2025, we conducted an analysis to understand what the decision by Uber and Lyft riders to use rideshare instead of public transit told us about how they valued their time.

Our peer-reviewed findings might help Philadelphians decide whether they want to support the mayor’s proposal.

Lessons from Chicago rideshare study

We found that, per hour of time saved by taking Uber or Lyft, Chicago riders paid about $30. That’s roughly the average hourly wage in the Chicago region, which works out to $60,000 a year before taxes for full-time work.

Our analysis sampled eight days. About 1.4 million trips were recorded on these days, and we analyzed origin and destination information for 950,000 of these trips. The rest either started or ended at O’Hare airport, were ordered between midnight and 6 a.m. when public transit is unavailable, or had some missing data. We excluded rides in and out of O’Hare because although our analysis accounted for wait times for Uber and Lyft, our model could not simulate the queuing system at O’Hare.

Origin and destination information was consistently available at the community area level. A community area is one of Chicago’s 77 divisions, which can contain one or several neighborhoods. Each community area has an average of 35,000 people, although the largest is home to 105,000 people and the smallest to just over 2,000.

About 60% of the trips we analyzed had either origins or destinations in community areas with median household incomes over $100,000. A further 23% of rides originated or ended in areas with household incomes between $50,000 and $100,000. This suggests to us that most Uber and Lyft riders in Chicago are middle class or above.

About 1 in 6 trips – 17% to be exact – started or ended in community areas with household incomes of less than $50,000. A $50,000 household income is roughly 150% of the federal poverty line for a four-person family in Chicago.

This suggests that ride-hailing is already unaffordable for these customers, and they are perhaps using it as a last resort. For example, public transit might not be available where they are or want to go, is too slow or is affected by bad weather.

Aerial view of block of colorful two-story rowhomes
Ride-hailing is already unaffordable for many people, who turn to it only as a last resort when public transportation is not readily available.
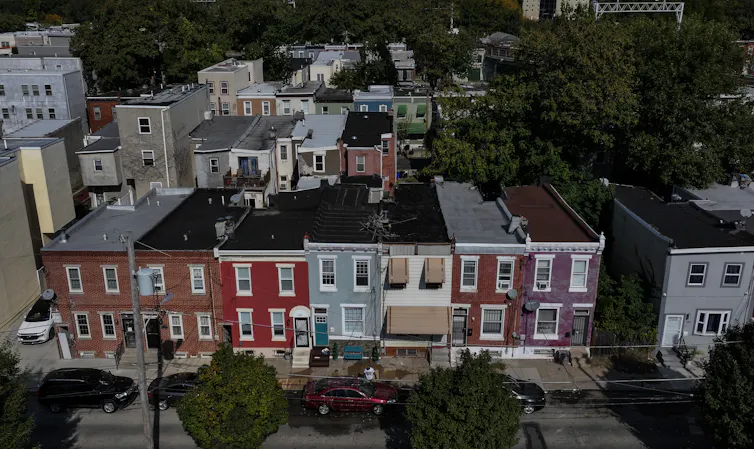
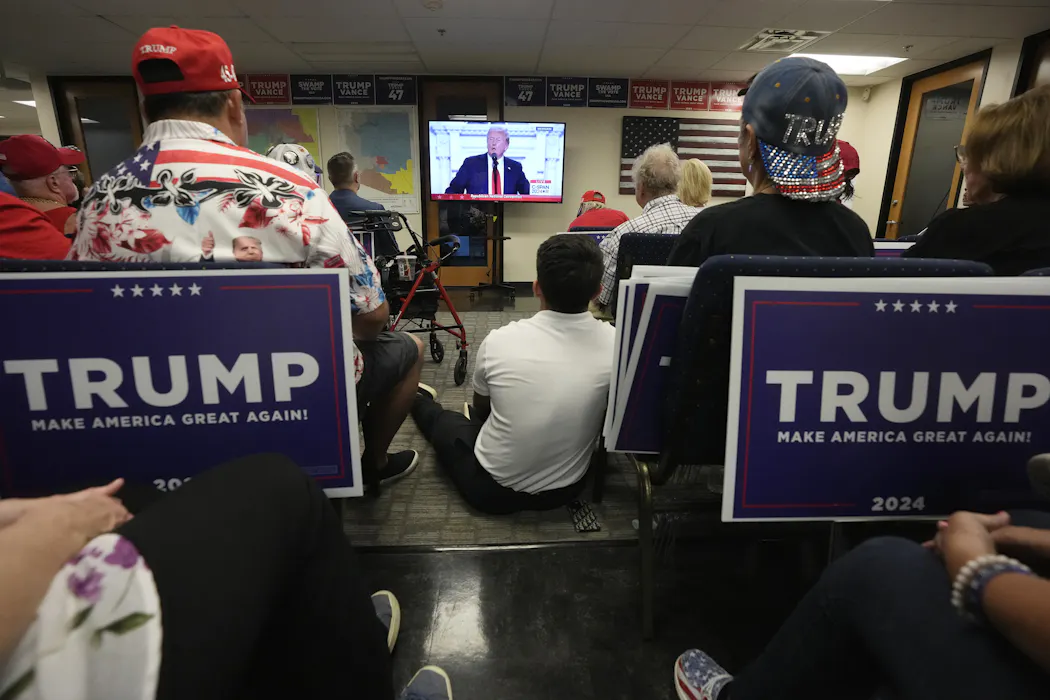
Ricky Carioti/The Washington Post via Getty Images

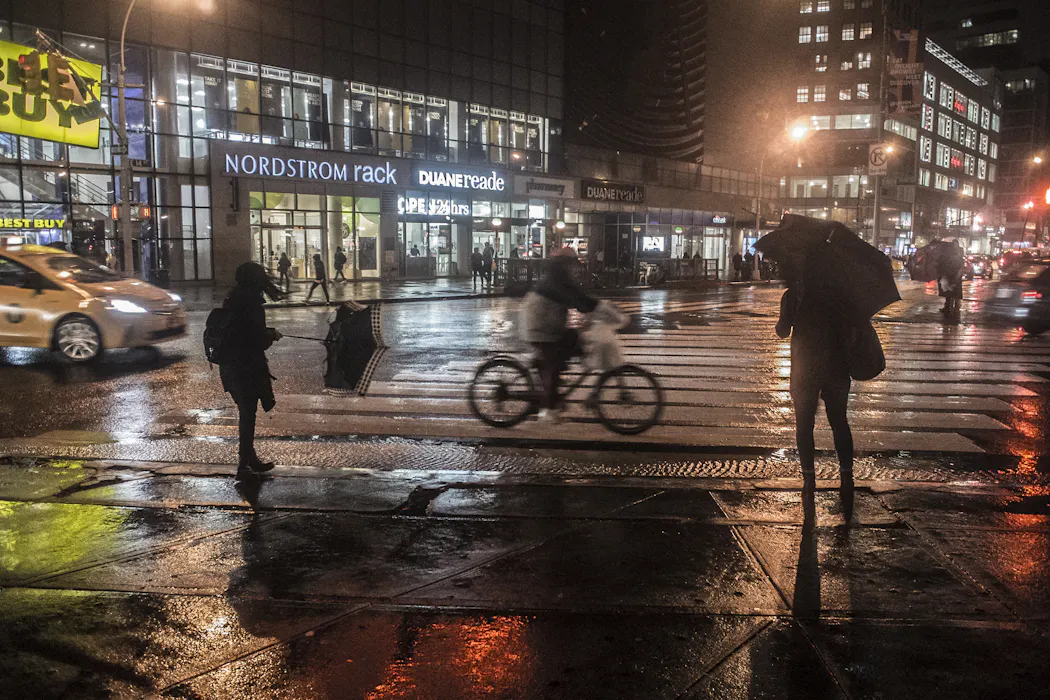
Low-income riders sensitive to extra fees

Another Chicago study, conducted by researchers at MIT and published in 2023, provides some evidence on the effect of the city’s Ground Transportation Tax. Beginning in January 2020, Chicago added an additional charge of $1.13 per ride-hailing trip, and an additional $1.75 for weekday trips that started or ended in downtown between 6 a.m. and 10 p.m. The revenues went to the city’s Corporate Fund, which supports city operations and services, including improving service on Chicago public transit.

That study found that Chicago’s tax produced a significant reduction in trips between downtown Chicago and the South and Southwest of Chicago, two areas with a high proportion of low-income and Black residents.

The study notes that this is most likely because low-income people who live in these areas find ride-hailing too expensive to begin with, and are therefore more sensitive to additional fees.

In many parts of Chicago, the 6 a.m. to 10 p.m. weekday fee led riders to shift to pooled Uber and Lyft rides. Citing past research, the authors speculated that the reason this shift to pooled rides did not happen in South Chicago was that area likely has fewer Uber and Lyft drivers nearby, given that ride-hailing drivers tend to concentrate in wealthier areas with more demand.

This conclusion rests on a prior Chicago-based study conducted in 2018 and 2019 which found that areas with lower-income households requested five times fewer trips than areas with higher-income households.

A New York-based study similarly found that public transit, bike-sharing and ride-hailing all served wealthy areas of the city far better than they did poorer areas.

Limited data sharing in Philly

Philadelphians who worry that the additional $1 per ride fee will put ride-hailing beyond the reach of low-income riders should note that ride-hailing is already an unaffordable last resort for many in this demographic.

Also, what may be true in Chicago or New York may not be true in Philly. A Chicago ordinance requires rideshare companies to report data on their activities on a monthly basis. The analysis we did in Chicago was possible because Chicago publishes anonymized information about every Uber and Lyft ride taken in the city. This data includes the approximate origin and destination of the ride, approximate start and end times, and the cost.

One way to test which Philadelphia communities that a $1 fee would most affect would be for Uber and Lyft to make such data publicly available for Philadelphia, as they do for Chicago and New York. Uber’s assertion that this tax would disproportionately hurt working-class Philadelphians is based on its own analysis of its own data, not on transparent analysis of publicly available data.

Uber did not respond to our query about whether they share data that independent researchers can access to determine which Uber riders in Philadelphia would be most affected by the proposed fee. Lyft referred us to their March 2025 , which states that 61% of Philly rides start or end in low-income areas. They did not respond to a follow-up question regarding how a low-income area was measured or defined.

Read more of our stories about Philadelphia, or sign up for our Philadelphia newsletter on Substack.

The Conversation

The authors do not work for, consult, own shares in or receive funding from any company or organization that would benefit from this article, and have disclosed no relevant affiliations beyond their academic appointment.

ref. Would a $1 rideshare fee affect wealthier or working-class Philadelphians more? 2 Chicago studies offer some perspective – https://theconversation.com/would-a-1-rideshare-fee-affect-wealthier-or-working-class-philadelphians-more-2-chicago-studies-offer-some-perspective-281697

From medieval plague ships to hantavirus: How outbreaks at sea helped to shape the international public health system

Source: The Conversation – USA (3) – By Katrine L. Wallace, Assistant Professor of Epidemiology and Biostatistics, University of Illinois Chicago

Passengers on the the hantavirus-stricken cruise ship MV Hondius watch epidemiologists board the boat in Praia, Cape Verde, on May 6, 2026 AP Photo/Uncredited

Cruise ships are convenient floating hotels by which to see far-flung parts of the world – but as an epidemiologist, I know they are also everything an infectious pathogen could want: thousands of strangers packed into enclosed spaces for days or weeks, sharing dining rooms and high-touch surfaces such as elevator buttons and handrails, breathing recirculated air.

Each new port of call where passengers can explore for a few days is an opportunity for germs to embark – and once they do, they encounter a highly efficient setting for hopping from host to host.

The MV Hondius confirmed this well-known fact in April 2026, when an outbreak of Andes hantavirus began aboard the Dutch-flagged expedition vessel carrying 147 passengers and crew from 23 countries.

The Andes virus is one of several species of hantaviruses. It is the only one known to spread from person to person, though it doesn’t do so very efficiently. It is far less contagious than COVID-19 or the measles.

As of May 14, a total of 11 cases, including three deaths, have been reported in the Hondius outbreak.

Outbreaks at sea are one of the oldest problems in public health. From medieval plague quarantines to modern times, they have repeatedly tested the ability to control infectious disease – and have played a key role in shaping the international public health framework in place today.

That interconnected public health system, however, depends on the cooperation of countries around the globe.

From harbor quarantine to global disease control

The word “quarantine” was first documented in the English language in 1663, in the Oxford English Dictionary, which defined it as a period of 40 days during which people who might spread a contagious disease are kept isolated from the rest of the community.

The first official quarantine, though, came earlier, in 1377, when the Republic of Ragusa – modern-day Dubrovnik, Croatia – ordered ships from plague-affected ports to anchor offshore for 30 days before anyone could disembark. A quarter-century later, Venice extended this period to 40 days – hence the “quarantine” term, which stuck. In 1423, Venice officially opened the world’s first permanent quarantine island, the Lazzaretto Vecchio, specifically to manage the problem of the plague arriving by sea.

A black and white historical illustration of an island,
Lazzaretto Vecchio, the first quarantine island, was established in 1423.
Wikimedia Commons

The system worked during the medieval era because a single authority usually controlled most harbors. Ships waited because they recognized states’ authority to detain them.

For centuries, maritime quarantine operated on this principle. Harbor officials wielded broad public health powers over incoming vessels. In the 19th century this practice continued in the United States. Cholera ships – a nickname for trans-Atlantic vessels carrying migrants and troops that were breeding grounds for cholera and other diseases – arrived from Europe and the Mediterranean and sat offshore in New York for weeks. At quarantine stations on Ellis Island and ports across the Atlantic seaboard, ships were inspected, passengers isolated and captains overruled by public health officers who had the legal authority to isolate passengers for extended periods.

The system was crude and often brutal. Ships of the medieval period were floating sickrooms with poor conditions: putrid water in the casks, bread full of worms, and passengers packed into pitch-sealed berths with lice in the bedding and the bilge stinking under them. Many people died on board. But the system rested on a foundation of recognized, enforceable authority over the vessel and everyone on it for the purpose of protecting the city from disease.

International cooperation

As maritime trade and travel became increasingly globalized, however, no single port or government could manage outbreaks alone. Also, advances in vaccines, antibiotics and sanitation led many countries to downsize the maritime quarantine systems that had once defined disease control at sea.

This forced quarantine systems to evolve from local harbor control into international frameworks for coordination. The World Health Organization was established in 1948, and the International Health Regulations were created in 1969 to manage disease across borders.

Countries agreed to share information, notify one another of outbreaks and coordinate responses at ports and borders. The responsibility no longer fell on a sole harbormaster, but the system was designed to perform a similar coordinating function across an increasingly interconnected world.

Even within that system, however, cruise ships remain unusually vulnerable outbreak environments. A highly visible example was a COVID-19 outbreak that occurred on the Diamond Princess in 2020. The cruise ship, which was anchored off the coast of Yokohama, Japan, produced weeks of confusion between Japanese authorities, the British cruise operator and a dozen foreign governments as they struggled to coordinate responsibility for the 3,700 passengers and containment measures.

Some analyses later suggested the shipboard quarantine may have amplified transmission. At the time, most observers treated it as a crisis specific to the early chaos of the pandemic.

But the Hondius outbreak suggests the problem runs deeper.

The Andes hantavirus can spread from person to person, but not very efficiently.

Ships cross borders – so too do pathogens

Cruise ships combine dense social mixing, international mobility and fragmented legal authority in ways that continue to challenge modern disease-control systems – even decades after the creation of international public health frameworks designed to coordinate them, and even for diseases like Andes hantavirus that are extremely unlikely to cause a pandemic.

As the cruise industry has grown, it has expanded into more remote and epidemiologically unpredictable environments – expedition voyages to Antarctica, the Amazon, Alaska. Alongside the industry’s ambitions, disease risk has also increased. These trips routinely bring large groups of passengers into contact with wildlife, pathogens and ecosystems they may have little prior exposure to and then seal travelers together for weeks.

Nevertheless, the United States chose in January 2026 to withdraw from the World Health Organization, the primary institution administering the framework designed to coordinate responses when disease crosses the borders that cruise ships cross as a matter of routine.

The Trump administration framed the exiting of international organizations as a means of protecting U.S. sovereignty. In practice, it meant that when the Hondius needed a response, the U.S. participated from outside the systems it had spent decades helping to build.

A crack in the system

In the outbreak on the Hondius, the international system still functioned.

The WHO still issued risk assessments and guidance. The European Centre for Disease Prevention and Control still coordinated the response across Europe. And in the U.S., the Centers for Disease Control and Prevention belatedly issued a health alert to physicians.

What changed is that the U.S. moved from being a central participant in the international public health system to operating more from its edges.

Who can say whether the next big outbreak will come from a disease spread on a cruise ship – or whether the pathogen involved will be one that spreads more efficiently between people than the Andes strain of the hantavirus does.

Whatever its source, outbreak response depends on cooperation between major governments, rapid information sharing and coordinated logistics. When a country as globally connected as the U.S. steps back from those systems, managing international health emergencies becomes slower, more fragmented and more dependent on ad hoc negotiations. Ultimately, this may make the world less safe.

The Conversation

Katrine L. Wallace does not work for, consult, own shares in or receive funding from any company or organization that would benefit from this article, and has disclosed no relevant affiliations beyond their academic appointment.

ref. From medieval plague ships to hantavirus: How outbreaks at sea helped to shape the international public health system – https://theconversation.com/from-medieval-plague-ships-to-hantavirus-how-outbreaks-at-sea-helped-to-shape-the-international-public-health-system-282957

Who shops at farmers markets in the US?

Source: The Conversation – USA (2) – By Bret R. Shaw, Professor of Life Sciences Communication, University of Wisconsin-Madison

People who shop at the more than 8,700 farmers markets operating in the U.S. either year-round or seasonally generally fall into six distinct groups. Three of them are more interested in farmers markets than the others. I study local food systems as a strategic communications scholar, and that’s the main takeaway from a study that I conducted with several colleagues.

As we explained in the March 2026 edition of British Food Journal, people who fall into those groups have different levels of interest in farmers markets but also have some things in common. Most people who shop at them are motivated to go because they want healthy, fresh food, they support local farmers and they think going to the farmers market is fun.

This is not a niche activity. An earlier study I worked on found that 81% of U.S. adults said that they shop at a farmers market at least once a year.

For both studies, we pulled survey data from a nationally representative sample of 5,141 U.S. consumers that was conducted Aug. 2-11, 2023. It had a margin of error of plus or minus 1.8 percentage points.

Researchers define farmers markets and local food in different ways. So we asked respondents to simply think of farmers markets as places where they can buy food directly from more than one vendor and where all or most of the items are locally grown, raised or made. We defined local food as being grown in their state or 250 miles or less from their homes.

Highly engaged, health-focused and emerging interest

We determined that about 18% of those surveyed are “highly engaged” farmers market shoppers. They care a lot about food and enjoy buying, preparing and eating fresh food. They are excited about many aspects of farmers markets, which are places where this group shops for a variety of reasons, such as supporting local farmers, buying nutritious, delicious food and connecting with community.

Nearly 65% of these shoppers were women. This group was the most diverse, with 27% of respondents identifying as Hispanic, 20% Black and 4% multiracial. They also had significantly lower average annual household incomes than other groups, averaging US$40,000-$50,000.

We found that another 18% of the people surveyed were “health-focused.” Like the highly engaged shoppers, they make buying and eating healthy food a high priority. However, this group doesn’t enjoy cooking as much. The health-focused group tends to avoid genetically modified foods, as well as convenient options like takeout food, frozen dinners and microwave-ready meals.

About 58% of them were women and their average age was 57, making them the oldest of the groups. Roughly 70% of the health-focused group was white, making it less diverse than the highly engaged group but more diverse than some of the other groups.

Finally, about 19% of the respondents were what we called “emerging interest” farmers market shoppers. They value convenience and learning about food. This group was the most likely to see going to the farmers market as a fun activity.

Emerging interest shoppers were nearly evenly split by gender, with 52% women. Their average age was 44 years old, making them the youngest of the groups.

People buy vegetables from a farmers market vendor
It’s not always a love of radishes that draws shoppers to these stalls.
Lev Radin/Pacific Press/LightRocket via Getty Images

Convenience, practicality and happenstance

We also identified three groups of consumers who were less interested in farmers markets than the highly engaged, health-focused and emerging interest shoppers, even if some of them do occasionally shop at the markets anyway.

About 16% of farmers market shoppers are people we identified as “convenience” shoppers. They are more likely to eat frozen dinners and buy takeout. They rarely cook meals from scratch using produce and other fresh ingredients.

About 43% of them say they never or rarely shop at a farmers market. Around 59% of them are men and 37% are people of color.

A vendor sells prepared foods at a market stall.
Tashana Small sells mac and cheese ‘cupcakes’ topped with pulled pork, Buffalo chicken tenders and Cajun shrimp at a farmers market on Long Island in 2023.
Erica Marcus/Newsday RM via Getty Images

Roughly 17% of these shoppers fall into a “practical” category. They methodically plan their grocery shopping and are among the least interested in farmers markets, with more than half saying that they either rarely or never shop at them.

Practical consumers were close to evenly split by gender; 53% were women. Their income tended to be the highest of the groups, typically in the $60,000-$75,000 range.

We called the 12% of the shoppers in the final group we surveyed “uninvolved.” This group showed very little interest in farmers markets or any other food-related activities. About 3 in 4 rarely or never go to farmers markets. Nearly 70% of uninvolved farmers market shoppers were men and 76% were white.

When someone in the uninvolved group goes to a farmers market, they may be going out of happenstance or because someone in their life wants them to go – not due to any personal interest.

If you forget, you’ll miss it

We believe this information could help farmers markets better serve their customers and perhaps attract more shoppers.

People can, of course, go to farmers markets for more than one reason, and not everybody fits neatly into one of these categories. And everyone we surveyed had something in common: Forgetting to go was the biggest reason shoppers of all kinds didn’t make a trip to the farmers market in a given week.

The Conversation

Bret Shaw’s work tied to this article was supported by the U.S. Department of Agriculture National Institute of Food and Agriculture (USDA NIFA, award no. 2023-68006-38984).

ref. Who shops at farmers markets in the US? – https://theconversation.com/who-shops-at-farmers-markets-in-the-us-279922

A ‘super El Niño?’ Why it’s too early to forecast one with certainty, but not too soon to prepare

Source: The Conversation – USA (2) – By Pedro DiNezio, Associate Research Professor in Climate Modeling, University of Colorado Boulder

El Niño can mean a rainy U.S. Southwest, warmer winters in the North and less Atlantic hurricane activity – but not always. Bill Tompkins/Getty Images

Talk of a “super El Niño” developing in 2026 is gaining momentum, with concerns rising that this climate pattern could bring extreme rainfall, heat, drought and destructive flooding around the world.

The signals appear to be in place: The tropical Pacific is warming along the equator, and computer models point toward extreme conditions by the end of the year.

However, forecasting El Niño is not like predicting next week’s weather. Forecasts for El Niño typically aren’t reliable before late spring – not because scientists don’t understand the system, but because we understand its limits.

A global map showing a streak of high ocean temperatures off South America in the Pacific along the Equator.
Sea surface temperature data on May 12, 2026, shows warming along the equator west of South America, often a sign that El Niño conditions are developing.
NOAA Coral Reef Watch

As an ocean-atmospheric scientist who studies El Niño, I spend a lot of time thinking about what scientists can forecast confidently – and what remains uncertain. Here’s what we know about the current event, what we still don’t, and why many regions should begin preparing now, even if a strong, or “super,” El Niño never fully materializes.

Why is El Niño hard to forecast in spring

The starting point for any El Niño forecast is the heat stored beneath the surface of the eastern equatorial Pacific Ocean. Computer models use data about those conditions to simulate how ocean temperatures will evolve over the coming months, and how they affect weather patterns around the world.

Right now, an exceptionally large reservoir of warm water sits beneath the surface there. In principle, this ocean heat should be a reliable signal of El Niño developing. In practice, what happens next depends heavily on what the atmosphere does.

The warm reservoir was shaped by a burst of wind activity in early 2026. Normally, the Pacific trade winds blow from east to west along the equator, pushing warm water toward Asia and leaving cooler water near South America. But in April, a pair of cyclones straddling the equator caused the wind direction to reverse. This short-lived reversal triggered a downwelling Kelvin wave – a pulse of energy beneath the ocean surface moving eastward along the equator.

That subsurface pulse has now reached the eastern Pacific, helping fuel intense warming off South America. At the ocean surface, this can resemble the early stages of a strong El Niño.

But there is a catch.

For El Niño to develop fully, the ocean and atmosphere need to lock into a feedback loop: Warmer surface waters weaken the trade winds, triggering more downwelling Kelvin waves that push warm water eastward and reinforce the warming. But that loop doesn’t engage automatically. It requires repeated bursts of eastward winds to sustain the process.

Until that feedback loop takes hold, the ocean-atmosphere system is in an unpredictable phase. It might tip into a super El Niño. It might not.

Spring is precisely when forecasts are most uncertain. Impressive early signals can fade if the winds don’t cooperate.

A line chart shows the relative oceanic Nino index, tracking sea surface temperature anomalies compared to average.
El Niño forms when surface temperatures in the tropical Pacific Ocean are about 0.5 degrees Celsius (0.9 Fahrenheit) warmer than normal for three months. A strong El Niño has temperatures over 1.5 C (2.5 F). The chart shows the Relative Oceanic Niño Index (RONI), a three-month running average that accounts for the background warming trend. Some forecasts still rely on the Oceanic Niño Index, based on absolute temperatures, which can overstate El Niño’s strength in a warming climate.
NOAA

There’s a further complication: When models detect strong subsurface warming, they can simulate a stronger feedback loop than actually develops.

The result is that models can look too confident – even alarming – despite the system not being locked in. As of mid-May 2026, the wind patterns needed to amplify the warming have not clearly emerged.

We’ve seen this scenario play out before. In both 2014 and 2017, forecast models were pointing toward strong El Niño conditions by midyear. In both cases, the anticipated wind patterns never fully materialized and El Niño either stayed weak or returned to a neutral state. The early signals were real, but the expected follow-through didn’t happen.

So what do the forecasts suggest?

The current forecasts for 2026-27 still span a wide range in mid-May – from expecting weak to strong El Niño conditions.

How the winds behave in the coming weeks will determine what develops. If trade winds weaken again at the right moment, it could tip the system into self-sustaining warming – the kind that’s hard to stop.

As of mid-May, long-range weather forecasts weren’t showing strong eastward wind bursts on the horizon that could strengthen El Niño. In fact, quite the opposite was expected for the second half of May: a burst of winds blowing in the opposite direction. A full month without major eastward wind activity would be a meaningful brake on ocean warming.

The Pacific has loaded the dice for El Niño, and the National Oceanic and Atmospheric Administration’s May outlook reflects elevated odds of El Niño developing and potentially strengthening later in the year. By NOAA’s mid-June update, the picture should be substantially clearer.

El Niño intensity matters for weather worldwide

The difference between a weak El Niño and an extreme one is not subtle. It reshapes climate patterns across the globe – and with them, real-world risks.

If El Niño intensifies into a strong or “super” event, it can drive drought in the Amazon, fires in Indonesia, flooding in Peru and heavy rainfall in parts of California and southern South America. These effects could materialize by the Northern Hemisphere winter, when El Niño typically peaks.

A world map shows cool, wet conditions across much of the southern U.S., warmer in the Northwest through Canada and Alaska.
How El Niño tends to affect the weather and climate around the world. El Niño’s affects vary based on many factors, so not every El Niño year will look exactly like this.
NOAA

In some regions, the stakes are immediate.

In India, the monsoon rains, which support agriculture and water supplies for hundreds of millions of people, have historically weakened during strong El Niño events. Even modest shifts in monsoon strength can bring food and water shortages, and harm economies.

At the same time, when El Niño is strong, hurricane activity in the Atlantic is typically suppressed – a rare upside – while the eastern Pacific often becomes more active with storms.

NOAA scientists explain how El Niño affects weather across the U.S.

El Niño can even push global temperatures temporarily higher, as changes in cloud cover and the amount of heat the ocean releases alter the planet’s energy balance.

In contrast, a weak El Niño produces far more muted effects. This is why predicting intensity matters.

Using uncertain forecasts in real-world decisions

Because El Niño forecasts deal in probabilities, deciding how to prepare for the seasons ahead should be based on managing risk – not waiting for certainty.

El Niño’s impact does not occur everywhere at once. Some effects emerge quickly. Its impact on the Indian monsoon and Atlantic hurricane activity unfold over the summer and early fall.

Other impacts arrive later, toward the end of the year when El Niño peaks, bringing extreme rainfall to parts of South America between November and January. In Southeast Asia, scorching heatwaves often emerge even later, in April of the following year.

In regions like India, decisions about how to respond to El Niño risks cannot wait for more certainty. Communities need to prepare their water infrastructure now in case El Niño means the monsoon season brings too little rain.

Even where forecasts suggest reduced risks – such as a quieter Atlantic hurricane season – it would be a mistake to assume safety. Destructive hurricanes still hit in otherwise quiet years.

The Conversation

Pedro DiNezio receives funding from NSF and NOAA. He is affiliated with the ATLAS Institute at the University of Colorado.

ref. A ‘super El Niño?’ Why it’s too early to forecast one with certainty, but not too soon to prepare – https://theconversation.com/a-super-el-nino-why-its-too-early-to-forecast-one-with-certainty-but-not-too-soon-to-prepare-282574

Will future missions to the Moon be sustainable? It may depend on whom you ask

Source: The Conversation – USA – By Marco A. Janssen, Professor of Sustainability, Arizona State University

Earth draws closer to passing behind the Moon in this image captured by the Artemis II crew during their lunar flyby. NASA

There’s a new space race to the Moon, and this time the ambitions are not just to visit but to stay. NASA’s Artemis program aims to establish a long-term human presence on the lunar surface in the 2030s. China, India, Japan and a number of private companies all have lunar mission programs of their own.

As of now, the human footprint on the Moon is small. That could change with the planned increase of lunar missions.

National space agencies are focused on science and exploration, while private companies aim to develop a lunar economy – potentially with mining operations. In the coming years, these groups will test technology and build some initial infrastructure on the Moon. From 2030 onward, Moon bases could become a reality.

But what are the long-term consequences of lunar missions for the Moon itself? The Artemis program’s goals are sustainable exploration and setting up a sustainable presence on the Moon. However, sustainability is a broad concept with a variety of definitions and uses when it comes to space exploration. As a sustainability scholar, a space systems engineer and a planetary scientist, we’ve been trying to pin down what sustainability means in a lunar context.

The delicate lunar environment

Unlike Earth, the Moon has no biodiversity, climate as we typically think of it, or oceans. But it does have its own active environment. While the Moon may seem unchanging and indestructible, it is surprisingly sensitive to human activity. Without the wind, water or other natural forces that reshape the Earth, things that happen on the Moon tend to leave a mark – sometimes for thousands, or even millions, of years.

When a rocket lands on the Moon, its engines blast the surface with exhaust gases and send fine dust particles flying at enormous speeds. A single landing by a large modern spacecraft, such as SpaceX’s Starship, could disturb an area of the lunar surface two to five times larger than the Apollo missions did in the 1960s and 1970s.

Some of those ejected dust particles can travel tens of miles across the surface, and the finest grains can reach the Moon’s orbit, potentially threatening other spacecraft. Images from satellites in lunar orbit show that changes to the uppermost layer of the surface from a single landing can remain visible for decades.

Landings can also release water vapor, carbon dioxide and other gases into the lunar exosphere – an extremely thin layer of atoms hovering above the surface – and create a temporary atmosphere.

And all these effects can come from just one mission. Future missions will focus on the polar regions, which have ideal spots for collecting solar energy atop peaks, as well as water in the form of ice in craters. Scientists don’t yet understand what the cumulative effects of the dozens of missions planned over the coming decade on the lunar environment – its surface, its thin atmosphere and its scientifically precious polar regions – will be, and whether they’re reversible.

A close-up view of an astronaut's bootprint in the lunar soil.
Without weather, footprints from human missions to the Moon last much longer than on Earth.
NASA

The concept of sustainability

On Earth, the concept of sustainability balances protecting the environment, maintaining economic well-being and caring for society – current as well as future generations.

But what does sustainability mean on the Moon? To find out, we sent out a survey asking people with a demonstrated interest in space and lunar exploration to define sustainability in this new context. We received 277 complete responses from academics, space industry professionals, space agency staff and engaged members of the public.

We found that people mean very different things when they talk about lunar sustainability – and those differences often track closely with who they are and where they work.

People working in the space industry tended to think about sustainability in financial and operational terms: keeping missions affordable, making infrastructure reusable, and developing the Moon’s resources to support a self-sustaining economy.

Academics, on the other hand, related lunar sustainability to environmental and ethical concerns more frequently. A significant portion of all respondents – roughly 1 in 5 – were opposed to large-scale human activity on the Moon altogether. Their responses echoed a “leave no trace” philosophy: Don’t disturb natural conditions, don’t commercialize what belongs to all of humanity, and don’t plant flags in places that shouldn’t be owned.

The majority of respondents fell somewhere in between, calling for a careful balance of scientific, commercial and environmental interests.

The Apollo 15 lander sitting on the surface of the Moon, with a panoramic view of the dusty, rocky lunar landscape.
Human activity, from robotic landers to crewed missions – such as Apollo 15, shown here – has the potential to reshape the surface of the Moon.
NASA

A continuing conversation

This diversity of perspectives on what sustainability means on the Moon is not a surprise. Even for the Earth, people do not have a universally agreed-upon perspective.

However, the shared cultural significance of the Moon calls for conversations between many groups of people, from space agencies to communities living near rocket launch sites, and from space industry professionals to amateur lunar enthusiasts.

The Moon has always been Earth’s closest celestial companion in our planet’s journey through space. As it becomes a destination for space agencies and some companies, the decisions made now will shape what the lunar surface looks like, and what the Moon means to people, for generations to come.

Some of those decisions may be irreversible. Researchers are only beginning to explore the cumulative effects of human activity on the lunar environment. And policymakers are even further behind in developing the governance frameworks needed to make collective decisions about it.

The conversation about what sustainability means for lunar missions is becoming increasingly relevant as plans for lunar bases move forward.

The Conversation

Marco A. Janssen received funding from NASA.

Afreen Siddiqi received funding from NASA.

Parvathy Prem receives funding from NASA.

ref. Will future missions to the Moon be sustainable? It may depend on whom you ask – https://theconversation.com/will-future-missions-to-the-moon-be-sustainable-it-may-depend-on-whom-you-ask-281095

Astrophysicists use ‘space archaeology’ to trace the history of a spiral galaxy

Source: The Conversation – USA – By Lisa Kewley, Director of the Center for Astrophysics | Harvard & Smithsonian, Smithsonian Institution

This artist’s impression shows the spiral galaxy NGC 1365 colliding and merging with a smaller galaxy. Melissa Weiss/CfA

Billions of years ago, a young spiral galaxy began to grow in a crowded part of the universe. It pulled in gas and small companion galaxies, slowly building up the bright central region and sweeping spiral arms we see today.

In a new study published in March 2026, my colleagues and I used this galaxy’s chemical fingerprints to reconstruct its life story in detail.

Astronomers want to know how spiral galaxies like our own Milky Way came to be, as these galaxies can give us hints about how the elements we rely on, such as oxygen, were created and spread through space over time.

Space archaeology

Like archaeologists sometimes use slices of earth to to turn back the clock and study the Earth’s natural history, we used slices of data of the galaxy’s chemical makeup from different periods in time, alongside sophisticated galaxy evolution models. Together, the data helped us piece together how it formed and grew over 12 billion years.

The galaxy, called NGC 1365, lies relatively nearby, in cosmic terms, and is tilted so we see its spiral disk face-on. Using the du Pont telescope at Las Campanas Observatory in Chile, we mapped oxygen across thousands of star-forming gas clouds.

We then searched through simulations of about 20,000 model galaxies and found one that very closely matched NGC 1365. We looked at a host of factors while matching up the simulations, including the abundance of heavy elements, including oxygen. We used the model to rewind the history of the galaxy and predict how it likely grew over time and merged with other galaxies.

Galaxies form when gravity and dark matter pull material together into their center.

Looking for heavy elements

Heavy elements are forged in stars and released in powerful supernova explosions within galaxies. Over time, this process builds up a traceable record that scientists can look for in the gas – like how archaeologists look for certain key elements in layers of soil.

Research has shown that the center of a galaxy usually ends up richer in heavy elements, while the outer regions have less. That pattern carries clues about when stars formed, how gas flowed in and out, and how often the galaxy collided and merged with others.

For the galaxy NGC 1365, we found that its central region likely formed early in its lifespan and quickly became rich in oxygen. Its outer disk, however, grew more slowly. Over billions of years, the galaxy probably collided with smaller dwarf galaxies, which brought in fresh gas and stars and helped build up the outer spiral arms. A lot of the gas now in the edges of the spiral arms likely arrived relatively late in the galaxy’s life.

Our work is some of the first to use such a detailed “chemical archaeology” technique outside our own Milky Way galaxy. By tying new, super-fine resolution observations directly to state-of-the-art simulations, we’ve opened up a new way to study how distant galaxies assembled over cosmic time.

Unanswered questions

We can reconstruct a history for NGC 1365 using both our simulations and observational data. But some details remain uncertain. Different combinations of gas flows and mergers can sometimes leave similar chemical patterns. We also don’t know yet whether NGC 1365’s life story is typical for large spiral galaxies, or whether it is unusual in ways that aren’t clear to us yet.

A few key things we have yet to uncover include: Do most spiral galaxies build their centers early and their outer disks slowly, as NGC 1365 appears to have done? How much do galaxy mergers versus gas inflow contribute to a galaxy’s growth? And, perhaps most interestingly, how does the history of NGC 1365 compare to that of our own Milky Way?

The Conversation

Lisa Kewley has previously received National Science Foundation and Australian Research Council grants but they did not support her role in this research project.

ref. Astrophysicists use ‘space archaeology’ to trace the history of a spiral galaxy – https://theconversation.com/astrophysicists-use-space-archaeology-to-trace-the-history-of-a-spiral-galaxy-278948

John Adams and Thomas Jefferson disagreed about the American Revolution’s meaning even as they lay dying

Source: The Conversation – USA – By Marianne Holdzkom, Professor of History, Kennesaw State University

The men responsible for producing the Declaration of Independence, known as the Committee of Five, were, left to right: Benjamin Franklin, Thomas Jefferson, Roger Sherman, John Adams and Robert R. Livingston. Vintage etching circa late 19th century, digital restoration by Pictore via Getty Images

Like Americans today, the people living in the United States in 1826 were preparing to celebrate a milestone for their country. July Fourth of that year marked the 50th anniversary of the Declaration of Independence.

As what was known as the “Jubilee” of American independence approached, Americans realized that the founding generation was dying off. They wanted to take advantage of the founders’ insight while they still could.

This meant soliciting memories and advice from the signers of the Declaration, only three of whom were still alive. Thomas Jefferson and John Adams were the men most closely associated with the independence movement, yet they both lay dying and both declined invitations to attend the festivities planned for July Fourth.

But they were able to answer letters from younger men interested in their perspective on the revolution and subsequent history they had helped shape.

As an Adams scholar and someone interested in how he is remembered, I have studied with interest his response to the questions posed to him. He also wrote a good deal about the revolution to his friend and onetime rival, Jefferson.

These two men – who had worked well together during the American Revolution – could not have been more different. Both had thought long and hard about what the American Revolution meant to them. They did not always agree.

If Americans today are looking for a unified vision of their country in their own 250th celebrations, they will not find it with Adams or Jefferson.

A single page publication with the title 'FUNERAL THOUGHTS EXCITED BY THE DEATH OF JOHN ADAMS AND THOS. JEFFERSON'
A broadside published in Boston following the deaths of John Adams and Thomas Jefferson on July 4, 1826.
Library of Congress Printed Ephemera Collection

Rival friends

After the Revolutionary War, Adams and Jefferson became political rivals. They disagreed about how powerful the federal government should be and on foreign policy at a time when England and France, once again at war, were presenting challenges to the new country..

Jefferson founded the Democratic-Republican Party to counter the influence of Alexander Hamilton’s Federalist Party. While Adams never formally aligned with the Federalists, he agreed with many of their policies, especially on foreign policy.

As a result, the friendship between Adams and Jefferson unraveled. For years, they did not speak or correspond until a mutual friend, Benjamin Rush, encouraged their reconcilation.

On New Year’s Day, 1812, Adams was the first to reach out. He used the excuse of sending to Jefferson a pamphlet written by his son, John Quincy, saying that it was from “One who was honoured in his youth with Some of your Attention and much of your kindness.” Adams continued, in casual language, to tell Jefferson about the family and wished him a happy new year.

Jefferson responded warmly, telling Adams, “A letter from you calls up recollections very dear to my mind.”

From that time on, the two wrote to each other on a regular basis, discussing every topic imaginable, from agriculture to religion. Yet it was clear that their past rift was on Adams’s mind when he wrote, “You and I, ought not to die, before We have explained ourselves to each other.”

In the process, they revisited the days when they worked together to form a new nation. As they reflected on the meaning of the United States’ birth, they agreed that writing a history of the American Revolution was next to impossible.

Adams wrote to Jefferson: “Who shall write the history of the American revolution? Who can write it? Who will ever be able to write it?”

The problem, as Adams saw it, was that so much was done in secret. Nobody recorded the debates and speeches of the Continental Congress, the governing body during the revolution. Therefore, how could a true history ever exist?

Jefferson agreed. After restating Adams’ question about who could write a true history, Jefferson’s response was “nobody; except merely it’s external facts.”

On this, they could agree. On some of the specifics, they did not.

Five men in colonial dress, standing next to a table covered with papers.
The Committee of Five – left to right: John Adams, Roger Sherman, Robert Livingston, Thomas Jefferson, Benjamin Franklin – presenting their draft of the Declaration of Independence to the Second Continental Congress in Philadelphia.
Detail from John Trumbull’s 1818 painting in the U.S. Capitol, via Wikipedia

Fundamental difference

In old age, Adams remembered vividly how he convinced Jefferson to write the Declaration of Independence. One historian has argued that Adams’ memory seems a bit too clear, and suggested that he was working to elevate himself in the process of telling the story by claiming that he alone persuaded a reluctant Jefferson to take on the task.

However, scholars still accept Adams’ version of this event. Jefferson remembered the incident differently, stating that he was urged by the entire committee charged with producing the declaration, not just Adams, to take on the task and that he was happy to comply.

More important than the details was the ultimate interpretation by these two men of what they had accomplished 50 years before.

What their letters written after the Jubilee committee’s invitation reveal is a fundamental difference in their attitudes about the human spirit. Adams wrote that he appreciated the invitation and was sorry to decline. He called the birth of the U.S. “a Memorable epoch in the annals of the human race.”

Yet he also demonstrated his realistic view of human beings when he wrote that the independence movement would “form the brightest or the blackest page, according to the use or abuse of those political institutions by which they shall be shaped by the human mind.”

Adams understood that people interpret history according to their own circumstances. He was a realist who could not bring himself to accept the fundamentally optimistic view that humanity was always moving toward liberty.

Jefferson, on the other hand, was hopeful about the revolution’s impact on the world. He believed that the declaration would be “the Signal of arousing men to burst their chains.” The entire letter to the Jubilee committee offered an optimistic view of the future in which the human race was always progressing toward freedom.

When Adams and Jefferson died on July 4, 1826, their lives took on new meaning. In eulogizing them, House member Daniel Webster told the American public: “They are no more. They are dead. But how little is there of the great and good which can die! To their country they yet live, and live forever.”

Now, 200 years later, Americans still look to these Founding Fathers for inspiration. However, what Adams and Jefferson demonstrate is not unity. Instead, they exemplify the capacity for people to disagree and yet work for a common cause.

The Conversation

Marianne Holdzkom is affiliated with the Adams Memorial Foundation. She is an Adams Memorial Foundation Scholar, but receives no compensation from them.

ref. John Adams and Thomas Jefferson disagreed about the American Revolution’s meaning even as they lay dying – https://theconversation.com/john-adams-and-thomas-jefferson-disagreed-about-the-american-revolutions-meaning-even-as-they-lay-dying-278347

Why a growing number of Trump supporters are experiencing voter’s remorse

Source: The Conversation – USA – By Tatishe Nteta, Provost Professor of Political Science, UMass Amherst

Phoenix residents watch presidential candidate Donald Trump speak at the Republican National Convention on July 18, 2024. AP Photo/Ross D. Franklin

In recent months, some prominent conservatives and erstwhile allies of President Donald Trump – former U.S. Rep. Marjorie Taylor Greene and journalist Megyn Kelly, for example – have voiced their displeasure with him on several issues. They range from Trump’s handling of the Iran war and the economy to the release of information concerning his relationship with convicted sex offender Jeffrey Epstein.

Most notably, political commentator Tucker Carlson, once one of Trump’s most stalwart loyalists, expressed remorse for his previous support for the president, declaring in April 2026, “It’s not enough to say, well, I changed my mind – or like, oh, this is bad, I’m out.” Carlson said he will be “tormented” by his support for Trump “for a long time” and that he is “sorry for misleading people.”

Growing unease with the Trump administration among these former allies comes amid some of the worst polling of Trump’s career. According to data compiled by pollster G. Elliott Morris, Trump’s popularity has been steadily declining over the past year. Americans are seriously questioning his handling of key issues, such as inflation, immigration, jobs and foreign affairs.

But beyond former prominent Trump allies, are there other Trump supporters having second thoughts about their votes in the 2024 presidential election? To answer this question, we conducted a nationally representative poll of 1,000 U.S. adults who were recruited from an online panel maintained by YouGov, a survey research firm.

We asked self-identified Trump voters about their votes in the 2024 election. Our results suggest that a growing number of them – especially moderates, African Americans and young people – are experiencing voter’s remorse.

A hand picks up a sticker off a table.
In our poll, roughly one-third of political moderates and African Americans who voted for Trump in 2024 said they would vote otherwise if the election were held again.
AP Photo/George Walker IV, File

Support for Trump remains strong

To be clear, our survey shows that most Trump voters remain in the president’s camp.

We found that 84% of 2024 Trump voters say they would vote for Trump if given the chance to vote again in the 2024 election. That’s down 2 percentage points since we previously asked this question in July 2025.

Over 90% of members of Trump’s core base of voters – including 93% of self-identified Republican Trump voters, 95% of self-identified conservative Trump voters and 92% of Trump voters over age 55 – said they would vote for Trump as they did in 2024 if given a second chance.

Regretful Trump voters

But some groups of Trump voters are having second thoughts. The most regretful are those with whom Trump made significant gains in 2024. They include political independents, African Americans, younger people and those with more education.

Roughly 3 in 10 2024 Trump voters who identify as political moderates and African Americans said they would vote differently if the election were held again. And roughly a quarter of young and middle-aged Trump voters also suggested they would not vote for Trump if they could redo their 2024 vote.

Twenty percent of Trump supporters with postgraduate degrees expressed a reluctance to vote for Trump if given a second opportunity. Voters with some college experience and those making less than $40,000 annually reported the same sentiment in similar percentages.

Perhaps most politically perilous, 31% of independents who voted for Trump in 2024 would not vote for him again in an election do-over.

Several people wearing baseball hats watch a man speak on TV.
New York City residents watch Donald Trump speak as votes are tallied for the presidential election on Nov. 6, 2024.
Fatih Aktas/Anadolu via Getty Images

Cracks in the coalition

What is pushing Trump voters away from the president?

There is no single cause, but our results suggest that negative perceptions of Trump’s performance on high-profile issues are playing a big role. A substantial portion of Trump voters who give the president a negative grade on the economy (22%), the Epstein files (37%) and the Iran war (49%) say they would not vote for him in an election redo.

Our results suggest that cracks are forming in the Trump coalition and that they are concentrated among the groups that before 2024 were less likely to vote for the president.

Trump may take solace in the continued loyalty of his strongest supporters. But in a close election every vote counts, and lingering dissatisfaction could undermine Republicans’ ability to mobilize key swing voters.

As Republicans face the electorate in upcoming midterms, Trump and the GOP will have to work to reclaim the support of regretful voters. Failure to do so could cost Republicans Congress in 2026 and, ultimately, the presidency in 2028.

The Conversation

Jesse Rhodes has received funding from the National Science Foundation, the Spencer Foundation, Demos, and the University of Massachusetts Amherst.

Adam Eichen and Tatishe Nteta do not work for, consult, own shares in or receive funding from any company or organization that would benefit from this article, and have disclosed no relevant affiliations beyond their academic appointment.

ref. Why a growing number of Trump supporters are experiencing voter’s remorse – https://theconversation.com/why-a-growing-number-of-trump-supporters-are-experiencing-voters-remorse-282230

How Trump plans to keep tariffs at the center of his economic policy despite stinging court losses

Source: The Conversation – USA (2) – By Kent Jones, Professor Emeritus of Economics, Babson College

President Donald Trump remains committed to using tariffs as a key tool for leverage and is looking at another authority that might raise tariff rates substantially. AP Photo/Noah Berger

President Donald Trump just can’t quit tariffs.

He suffered a major defeat when the Supreme Court ruled in February 2026 against the sweeping emergency tariffs he announced the previous year. Then, on May 7, a federal court knocked down the interim tariffs he announced after the high court’s decision.

Yet Trump appears undeterred and keeps finding a plan B – and then C and D.

“So, we always do it a different way,” the president told reporters after the May 7 decision. “We get one ruling, and we do it a different way.”

That different way, currently, is using an authority called Section 301. This option is likely to invite more litigation, but it may wind up more powerful and durable than previous levies. To that end, the administration has opened two probes, paving the way for fresh tariffs later this year against China and other major trading partners.

Why does this matter? U.S. trade policy, to the average person, may seem like a complicated mess of acronyms and legalese. But as a trade economist who has been following the tariff wars, I believe Trump’s strategy of making aggressive global tariffs the centerpiece of his foreign economic policy is quite clear – even as his trade policy overall remains deeply unpopular.

And if he succeeds, the average levy may jump to the highs of the “Liberation Day” tariffs of April 2025, before some were scaled back in subsequent – if incomplete – deals with trading partners.

A tariff obsession

At first glance, Trump’s fixation with tariffs may seem surprising.

They have failed to stimulate U.S. manufacturing and employment, while
consumers and importers have absorbed the brunt of the price hikes. But to Trump, what seems to matter is that the Supreme Court took away his tariff-making power when it ended his emergency tariffs. He now wants that power back.

Indeed, that power was the appeal of the Liberation Day tariffs, which let Trump set tariff rates at any level and for any length of time, with the flexibility to assign different tariffs to different countries. With such tools, he could threaten more punishing levies to enforce bilateral trade deals.

In addition, he saw the revenue that those tariffs brought in as a source of power and has resented the Supreme Court order that they be refunded to the U.S. companies that paid them. Trump is even angry at any companies that have decided to collect the tariff refunds.

But Trump is especially furious at his Supreme Court appointees, Amy Coney Barrett and Neil Gorsuch, whose votes swung the February decision, and continues to excoriate them. He declared he was “ashamed” of all the justices who voted to strike the tariffs, characterizing them as “fools” and “lapdogs” who didn’t have “the courage to do what’s right for our country.” Trump also said the court’s decision would inadvertently push him to “impose tariffs more powerful … rather than less.”

In short, Trump is moving from his Liberation Day tariffs to what I call “revenge tariffs” – in an attempt to show the high court that it cannot stop him.

Planning the next battle

Section 301 of the 1971 U.S. Trade Act is designed to remedy foreign countries’ trade practices deemed discriminatory, unfair, unreasonable or burdensome to U.S. commerce. It sets no limit on the tariff amount; lets the president discriminate among targeted countries; and generates tariff revenue without violating the Constitution’s taxation clause, a major element in the Supreme Court’s February decision.

Another potential advantage: Federal courts have typically given the president discretion in determining the purpose, scope and remedies chosen to implement Section 301.

The main reason why Trump didn’t use Section 301 last year for his Liberation Day tariffs – opting instead for another law, the International Economic Emergency Powers Act – was because he thought the latter would grant that kind of unlimited tariff authority but without any extra procedural requirements. To a certain point, that proved correct – until his Supreme Court loss.

Commerce Secretary Howard Lutnick, smiling, holds a large chart laying out countries' tariff rates as President Donald Trump announces new tariffs at the White House on April 2, 2025.
The ‘Liberation Day’ tariffs that Donald Trump announced in April 2025, seen here in a chart held by Commerce Secretary Howard Lutnick, gave the president sweeping powers.
AP Photo/Mark Schiefelbein

As for next steps, the Trump administration has proposed two Section 301 investigations. One is against alleged “excess industrial capacity” among several countries – shorthand for overproduction through government intervention – and the other against alleged failures to enforce bans on trade using forced labor.

To Trump, the appeal is that these probes have a vast scope. And he has already indicated that he seeks to use any tariffs stemming from the probes as leverage: If a country that has inked a trade deal considers abandoning the agreement, for example, Trump has warned that he could threaten Section 301 tariffs later.

“Any Country that wants to ‘play games’ with the ridiculous supreme court decision, especially those that have ‘Ripped Off’ the U.S.A. for years, and even decades, will be met with a much higher Tariff, and worse, than that which they just recently agreed to. BUYER BEWARE!!!” Trump wrote on his social platform, Truth Social, in February.

Using Section 301, in short, would be akin to declaring that every U.S. trading partner in some way damages the U.S. and will be targeted with punitive tariffs. This action would be unprecedented – and likely face legal challenges. These would first go to the Court of International Trade, which also nixed the interim tariffs, and appeals would go to the U.S. Court of Appeals for the Federal Circuit. The final instance of appeal would be the Supreme Court.

Fair and balanced?

International trade law has established mechanisms for trading partners to crack down on forced labor or address industrial capacity through policy changes or negotiations. In such a scenario, tariffs would provide the means, not the ends, to address these more substantive policy disputes.

But so far, Trump seems to have another goal: correcting the “unfair trade imbalances” that he also cited for the Liberation Day tariffs. One government Section 301 petition claims that foreign excess capacity is letting countries rack up “persistent” trade surpluses. Another claims that trade in forced-labor goods harms the U.S. trade balance by increasing U.S. imports of underpriced products and decreasing U.S. exports by forcing them to compete with cheap competition.

If these petitions succeed, Trump could then impose the Section 301 tariffs individually, country by country, as part of his global trade balancing goal. Trump also wants to seize back the revenue that his tariffs generated.

The catch is that Section 301 requires cases to be based on actionable practices, not trade balance outcomes. Moreover, the 2025 tariffs didn’t even accomplish any balancing: The U.S. deficit in goods actually increased that year. So using Section 301 is just as unlikely to improve the U.S. trade balance, which is determined by macroeconomic factors, not foreign excess capacity or imports of goods made with forced labor.

A question of deference

Will there be any guardrails on Trump’s plan to introduce the new tariffs in July 2026, as he has indicated? This will depend in part on whether courts continue the traditional deference of the pre-Trump era to the president in these cases.

Trump is counting on this, but it’s not a slam dunk. Many experts question whether overcapacity is a trade violation. And on the forced labor issue, the U.S. National Trade Estimate Report added potential offenders besides China only in March 2026 – an announcement well timed in anticipation of the current Section 301 case. The forced labor case may in fact be intended to compel U.S. trading partners to abandon supply chains that include Chinese goods.

But as it happens, the European Union and other countries are more effective than the U.S. in prohibiting forced-labor imports and therefore shouldn’t be targeted. Trade experts also point out that the U.S. itself produces forced-labor goods in private prisons and has often failed to stop forced-labor imports. It’s just as guilty as many other countries of not enforcing its ban on such trade, these legal scholars argue.

Still, courts have traditionally given latitude to the president on Section 301. It lets the White House pursue trade liberalization while respecting the norms of global trade rules that the U.S. championed at the time.

Trump has, in contrast, made a practice of undermining those rules and can be expected to stretch Section 301 as far as possible. Indeed, his rhetoric seems to suggest that the Section 301 cases were chosen primarily to establish a permanent tariff regime by providing all-purpose bargaining leverage, not correcting damaging foreign trade practices.

For these reasons, it’s likely that Trump will face legal challenges – as well as a potential impact on his party at the midterm ballot box – as he tries to test the limits of U.S. trade law.

The Conversation

Kent Jones does not work for, consult, own shares in or receive funding from any company or organization that would benefit from this article, and has disclosed no relevant affiliations beyond their academic appointment.

ref. How Trump plans to keep tariffs at the center of his economic policy despite stinging court losses – https://theconversation.com/how-trump-plans-to-keep-tariffs-at-the-center-of-his-economic-policy-despite-stinging-court-losses-282093

How much is a bat worth? Protecting these tiny insect-eaters isn’t just good for farms – their deaths cost taxpayers and the wider economy

Source: The Conversation – USA (2) – By Dale Manning, Associate Professor in Public Policy and Agricultural and Resource Economics, University of Tennessee

A healthy bat hangs in a cave, resting up to eat its weight in bugs at dusk. Liz Hamrick/TVA

Most Americans tend to think about bats only around Halloween, but the U.S. economy benefits from these furry flying mammals every day.

Bats pollinate plants, including many important food crops, when they stop by flowers to drink nectar. Their guano is mined from caves for fertilizer. And they eat a lot of bugs – the kinds that bother people (think mosquitoes) and others that destroy crops that humans depend on for food.

Sadly, bat populations are declining rapidly in North America. A driving force is a fungal disease known as white-nose syndrome, which has spread among bats throughout the United States. When a bat population crashes, fewer bats are around to eat bothersome insects. All those additional insects can do serious damage.

So, when bats disappear, farms become less productive, and that has broad implications for the agricultural economy, human health, rural governments and even financial markets.

Bats love to eat the bugs that bother people

First, consider how many insects bats eat.

A reproductive female big brown bat can eat its body weight in insects every night in the summer, precisely when farmers are growing food.

Hundreds of bats fly out of a cave.
Mexican free-tailed bats head out of Bracken Bat Cave, near San Antonio, Texas, for an evening of feasting on insects. In summer, the cave is home to the largest bat colony in the world.
Ann Froschauer/U.S. Fish and Wildlife Service

One of those insects is the cucumber beetle, which matures from rootworm – a scourge of U.S. cornfields. Rootworm destroys more than 340 million bushels of corn across the U.S. Midwest and South each year, even as farmers spend US$1 billion annually on pesticides to control outbreaks.

A colony of 150 big brown bats can consume 600,000 cucumber beetles in a single year. If each female cucumber beetle – assuming half are female – had 110 rootworm larvae, the typical brown bat colony would prevent the production of 33 million rootworms.

Farmers experience economic damage when rootworm concentrations exceed about 0.5 per corn plant. Typical planting densities exceed 30,000 corn plants per acre in the Midwest. Therefore, the rootworms that would have hatched could damage more than 2,000 acres of corn – if bats weren’t around to eat the cucumber beetles first.

That is a significant amount of pest control provided by bats!

The disaster known as white-nose syndrome

In the winter of 2006, the fungus that causes white-nose syndrome, the aptly named Pseudogymnoascus destructans, was first detected in the U.S. near Albany, New York.

From there, it spread across the country, infecting 12 species of bats, three of which are listed as endangered under the Endangered Species Act. A 2010 study found white-nose syndrome had killed between 30% and 99% of the bats in infected colonies.

A little brown bat with the telltale signs of white-nose syndrome, a fungal infection that saps the bats’ energy.
Ryan von Linden/New York Department of Environmental Conservation

As of March 2026, the fungus causing white-nose syndrome had been detected in 47 states, reaching as far west as California, Washington and Oregon. White-nose syndrome spreads primarily through bat-to-bat contact, though humans also contribute to the spread when cave explorers carry the fungus from one cave to another.

Despite coordinated efforts by state and federal wildlife agencies to limit access to caves where bats live and slow the transmission, white-nose syndrome continues to spread rapidly. When bats get infected, they wake up early from hibernation and use more energy over the winter. This depletes their fat reserves and causes them to die of starvation, leading to plummeting populations.

Bats’ role in food production

After white-nose syndrome arrives in an area, the loss of bats has significant consequences for farmers.

Yields fall as pests consume crops. To protect their crops, farmers purchase more chemical pesticides, so their costs rise as yields decline. The estimated agricultural losses from white-nose syndrome exceeded $420 million per year as of 2017.

A bat hovers by a large flower as it feeds on nectar.
A lesser long-nosed bat (Leptonycteris curasoae) feeding on an agave blossom in Arizona, spreading the flower’s pollen in the process.
Rolf Nussbaumer/imageBROKER

Greater pesticide use is also associated with human health problems that can be avoided if bat populations remain healthy.

Losing bats hurts local governments financially

The story does not stop at the farm.

Counties in all U.S. states tax agricultural land based on its “use value” – in other words, based on how profitable the land is in agriculture. Without healthy bat populations, lower profits shrink the tax base, leaving county governments with less revenue.

Those governments must respond by reducing services, raising taxes or increasing how much money they borrow – often at a greater cost of borrowing. The effect is especially pronounced in rural counties, where agriculture makes up a large share of property tax revenue.

Our recent research finds that rural county governments lost almost $150 per person in annual revenue after the arrival of white-nose syndrome. For an average-size rural county, that is nearly $2.7 million in lost revenue each year.

How losing bats can hit the bond markets

The loss of county revenue makes municipal bond investors nervous. Buying a municipal bond is a bit like lending money to the county, and the interest rate is what the county pays you for taking on that risk.

When bats disappear, the risk goes up, and the county has to pay about 11.47 hundredths of a percentage point more in interest. That may sound small, but it is 27% larger than the typical risk premium investors already demand from county governments.

The higher interest rate raises borrowing costs for county governments. For example, the borrowing costs on a typical 15-year, $1 million bond would increase by more than $33,000.

Two bats hanging in a cave.
Bats snuggle up in a cave.
Liz Hamrick/TVA

Higher yields also mean lower bond prices for investors, including retirement funds. For example, our research suggests that investors would discount a $1 million bond issued by a rural county by nearly $14,000 if that county’s bats have become infected by white-nose syndrome.

Economic benefits of saving bats

The good news is that the benefits from healthy bat populations create opportunities to make money from bat conservation.

Farmers can increase their incomes. Local governments can recover property tax revenue to fund public services, such as road maintenance, health infrastructure and public schools. Bond investors can earn financial returns from healthier bat populations.

No silver bullet exists for protecting or restoring bat populations affected by white-nose syndrome, but promising efforts are underway.

A fungal vaccine is being tested by the U.S. Geological Survey and partners. Designing artificial roosts and adding cave protections can also help preserve healthy bat populations. Researchers are also working to better understand bat resistance to the disease to explore whether improving resistance alone can stabilize bat populations.

As these solutions develop, opportunities will emerge for farmers, local governments and investors to earn financial returns through bat conservation. In other words, saving bats isn’t just good ecology – it’s good economics.

The Conversation

Eli Fenichel receives funding from the Knobloch Family Foundation. He is a professor at Yale University in the School of the Environment.

Anya Nakhmurina and Dale Manning do not work for, consult, own shares in or receive funding from any company or organization that would benefit from this article, and have disclosed no relevant affiliations beyond their academic appointment.

ref. How much is a bat worth? Protecting these tiny insect-eaters isn’t just good for farms – their deaths cost taxpayers and the wider economy – https://theconversation.com/how-much-is-a-bat-worth-protecting-these-tiny-insect-eaters-isnt-just-good-for-farms-their-deaths-cost-taxpayers-and-the-wider-economy-282014