Source: The Conversation – (in Spanish) – By Jorge Ferreira Barrocal, Profesor e investigador en el Departamento de Lengua Española, Universidad de Salamanca
Carlos y Daniel Ramos en un momento de la retransmisión de ‘La casa de los gemelos’, el ‘reality’ de los dos hermanos que fue cancelado tras 10 horas. ZonaGemelos/YouTube
ZonaGemelos es un canal que echó a rodar entre 2022 y 2023. Opera actualmente en YouTube, Instagram, TikTok y en la polémica Kick. Su impacto en internet queda evidenciado en el número de seguidores que suman sus cuentas.
La cifra sobrepasa el millón, y la suma no tiene en consideración el número de seguidores que indicaba el marcador de su cuenta en Twich en el momento en que fue prohibida (119 412, aunque ha subido). Recientemente emitieron un reality, La Casa de los Gemelos (cancelado después de 10 horas), que llegó a ocupar el segundo lugar en tendencias en España en X. Le siguió La gala de la Casa de los Gemelos, que llegó a concitar a 150 000 personas en YouTube. Los datos dejan fuera de toda duda que ZonaGemelos ha llegado para quedarse.
Los organizadores, los hermanos Carlos Ramos y Daniel Ramos (25 años, Getafe), han querido dejar claro que son dos chicos normales de barrio. Pero lo que vienen haciendo en los últimos tiempos trasciende todo aquello que pueda considerarse común.
¿Qué es ZonaGemelos?
El contenido de sus streams (emisiones continuadas) se podría resumir de este modo: personajes altamente dispares entre sí –muchos de ellos con algún tipo de diversidad funcional– se enzarzan en debates insustanciales que carecen de sentido alguno. Esto ha generado mares inmensos de clips que circulan a altas velocidades, sobre todo en TikTok.
El primer elemento que debe ser analizado en ZonaGemelos son los participantes. Citemos arbitrariamente los nombres de algunos de ellos: David Evil, Pájaro Azul, La Maeb, el Churumbel de Málaga, Mr. Tartaria, Misha, Mala Rodríguez, Paco Porras, Aramís Fuster, la Falete, Coto Matamoros, Pipi Estrada, Modric Shaolin, la Marrash, Manolito, Ruth “la Peke”, Skippy, etc. Los nombres de algunas de estas personas les sonarán a algunos lectores, pues varios de ellos han participado en programas televisivos como Crónicas Marcianas o Sálvame.
También ha habido apariciones estelares de artistas musicales en el género urbano como Bryant Myers o Morad, que han jugado, lógicamente, un rol diferente al de los anteriores.
Permítasame añadir ahora una precisión sobre el modo de actuar de los personajes en el programa. Los gemelos insisten mucho en el carácter novedoso y renovador de su método, pero lo que hacen es bastante tradicional. Algunos colaboradores reciben instrucciones para enfurecer a un compañero que jamás está prevenido, y ello genera una discusión que no pasa de insultos, procacidades, etc.
Con todo, hay aspectos que se remontan aún más al pasado, pues los gemelos –claramente sin ser conscientes de ello– activan mecánicas propias de la poética clásica de lo grotesco, pues buscan generar la risa con las singularidades de sus invitados.
Desde Quevedo (el del Siglo de Oro)
Esto en el mundo clásico era conocido como turpitudo et deformitas (que podría traducirse como “fealdad moral y fealdad física”). Los factores de este binomio sustentaron también la estética de la risa en la literatura del Siglo de Oro, y fue Francisco de Quevedo quien puso nombre a las posibilidades jocosas de la fealdad con la acuñación del concepto de figura en su obra Vida de la Corte y capitulaciones matrimoniales. El escritor distinguía entre figuras naturales y artificiales:
“Los naturales son los enanos, agigantados, contrahechos, calvos, corcovados, zambos y otros que tienen defectos corporales, a los cuales fuera inhumanidad y mal uso de razón censurar ni vituperar, pues no se lo adquirieron ni compraron excepto a los que de tal defecto hacen oficio”.
“Hay figuras artificiales que usan bálsamo y olor para los bigotes, copete, guedejas y aladares, de que usan mucho jaboncillo de manos y pelotilla de cera de oídos. Su conversación es damas, caballos y caza, visten y platican degenerando de la plebe y tal vez se tientan de poesía, a que se inclinan los enamorados, a quienes no satisface menos talento que el de Lope de Vega o don Luis de Góngora, por lo que han oído. Lo superior llaman bonito: lo bueno, razonable, y a lo malo, pésimo; nada les contenta: la causa nunca la dan por ser inferioridad. […] Son grandes estadistas de la vida, cobardes en extremo; tienen rufianes que riñan sus pendencias y los saquen de afrentas; rinden vasallaje de miedo a los desalmados y zainos; sus fiscales tratan con matusalenes, a quien estafan; son amigos de olor, comen más; juran ‘a fe de hidalgo’, ‘a fe de quien soy’ y ‘como quien soy’”
Como podemos ver, Quevedo distingue entre sujetos que resultan ridículos por sus características físicas y por sus conductas sociales. En el opúsculo de Vida de la Corte, el autor sugiere que los que han de ser censurados son los segundos: “Y porque he dicho sumariamente de las figuras naturales, diremos de las artificiales, contra quien mi intento va dirigido”.
Ni nuevo ni novedoso
Retrato de Francisco de Quevedo en Francisco Pacheco, ‘El libro de descripción de verdaderos retratos, ilustres y memorables varones’. Wikimedia Commons
Quevedo degrada a un amplio elenco de figuras artificiales en sus entremeses ya que –y esto es muy importante advertirlo– el poeta los despreciaba profundamente. Reprueba a los maridos consentidores en Diego Moreno, a las busconas en Bárbara o La polilla de Madrid, a los tacaños en El caballero de la Tenaza o a las personas que son incapaces de asumir los deterioros del paso del tiempo en La ropavejera.
Eugenio Asensio, uno de los filólogos más agudos del siglo XX, definió con precisión este tipo de entremeses, indicando que su “encanto reside en la variedad de tipos caricaturizados […] Es como una procesión de deformidades sociales, de extravagancias morales o intelectuales”. Asimismo, la poesía de Quevedo se mofó en algunas oportunidades de las figuras naturales. Baste rememorar el soneto “Érase un hombre a una nariz pegado” o los dos que dedicó a burlarse de los calvos.
El programa de los hermanos Ramos puede equipararse sin mayores dificultades con los catálogos de figuras de Francisco de Quevedo, puesto que unos y otros buscan provocar la carcajada del público a partir de las extravagancias.
Es decir, la cosa es básica, tópica y frecuente, porque así lo permite sustentar la evidencia literaria.
¿Quiere recibir más artículos como este?Suscríbase a Suplemento Cultural y reciba la actualidad cultural y una selección de los mejores artículos de historia, literatura, cine, arte o música, seleccionados por nuestra editora de Cultura Claudia Lorenzo.
Jorge Ferreira Barrocal no recibe salario, ni ejerce labores de consultoría, ni posee acciones, ni recibe financiación de ninguna compañía u organización que pueda obtener beneficio de este artículo, y ha declarado carecer de vínculos relevantes más allá del cargo académico citado.
Source: The Conversation – (in Spanish) – By Ramón Rueda-López, Profesor en el Dpto. de Organización de Empresas, UNED – Universidad Nacional de Educación a Distancia
shutterstock
¿Qué lleva a un joven a plantearse ser militar profesional? En plena era de job hopping o cambio de trabajo cada poco tiempo y empleos flexibles, podría esperarse que la respuesta a esta pregunta estuviera relacionada con factores como un sueldo estable o ventajas laborales. Pero un análisis de dos décadas de encuestas en España (1997-2017) muestra una realidad más compleja.
Las personas jóvenes se sienten atraídas por el ejército principalmente por valores altruistas, identificación con la profesión y prestigio institucional, no por razones económicas. Ni siquiera las crisis financieras aumentaron significativamente el interés por motivos materiales.
El gran giro silencioso de las Fuerzas Armadas
Para entender este fenómeno, primero debemos contextualizar la transformación del Ejército español. Tras la dictadura, la profesionalización del ejército (1996-2008) implicó cambios profundos que podrían evidenciarse a través de los siguientes aspectos:
El tránsito del soldado “héroe” al soldado gestor de la paz. Así, las misiones bélicas dieron paso a operaciones humanitarias y seguridad internacional.
La modernización chocó con las limitaciones presupuestarias que afectaron condiciones laborales.
Pese a estos cambios, el estudio mencionado demuestra que la imagen social de las Fuerzas Armadas apenas ha actualizado sus motivos de reclutamiento. Los jóvenes aún perciben la profesión con lentes más tradicionales de lo que podría esperarse.
Altruismo activo: la voluntad de defender España voluntariamente es el factor más determinante. Las personas jóvenes que considerarían ser soldados profesionales muestran un 40 % más de predisposición a servir a España que el resto.
Fascinación por lo castrense: el interés por temas militares (conversaciones, seguimiento informativo) es el segundo motor. Quienes muestran esta curiosidad tienen 2,5 veces más probabilidad de plantearse la carrera militar. No obstante, cuestiones relacionadas con la vida castrense, como la disciplina o el uso de uniforme, no tienen relevancia en cuanto al interés por lo militar.
Prestigio institucional: la valoración positiva del ejército como institución triplica su influencia respecto a factores como salario o estabilidad. Aquí hay un matiz clave: no es admiración por símbolos (bandera o himno), sino confianza en su función social.
Los mitos, derribados por los datos
Lo anterior refuerza el hecho de desterrar alguno mitos previos.
Mito 1. “En crisis, el ejército atrae por seguridad laboral”: falso. Los incentivos económicos como, por ejemplo, el sueldo digno o la posibilidad de promocionar son valorados genéricamente, pero no diferencian a quienes realmente consideran la carrera. Incluso en el periodo entre 2009 y 2013, cuando la crisis económica era más acuciante, estos factores no ganaron peso.
Mito 2. “Las personas jóvenes buscan aventuras”: parcialmente falso. Viajar o practicar deporte extremo apenas influyen. Solo el 15 % de quienes son aspirantes potenciales menciona estos aspectos. Lo que importa es el trabajo en sí, no sus “beneficios colaterales”.
Mito 3. “La familia militar es decisiva”: verdad a medias. Tener un familiar en las Fuerzas Armadas aumenta la predisposición, pero su influencia es menor que el altruismo o la valoración institucional. Además, este factor se mantiene estable desde 1997.
Entender estas motivaciones tiene implicaciones prácticas en lo que respecta, por ejemplo, al reclutamiento inteligente, es decir, abordar campañas centradas en el salario o las ventajas es poco efectivo. Funcionan mejor mensajes sobre servicio a la sociedad y profesionalismo. También a la gestión de talento –retener efectivos requiere potenciar camaradería y sentido de misión, no solo mejoras salariales– y al diálogo civil-militar –la ciudadanía valora más al ejército como garante de paz (66 % en 2017) que como fuerza bélica–. Reflejar esto mejora la imagen de las Fuerzas Armadas.
¿Soldados del futuro?
Los datos hasta 2017 no capturan impactos recientes (pandemia, guerra en Ucrania), pero dan pistas clave como la resistencia de los valores –pese a los cambios sociales, el núcleo duro de la vocación militar persiste–; la brecha generacional –las personas jóvenes privilegian servicio concreto sobre símbolos abstractos– y la visión de un futuro prometedor.
En tiempos de empleo volátil, la paradoja militar española ofrece una lección: cuando el trabajo tiene sentido trascendente, los incentivos económicos pasan a segundo plano. Quizás por eso, mientras otros sectores luchan por retener talento, el ejército sigue encontrando jóvenes dispuestos a servir.
Las personas firmantes no son asalariadas, ni consultoras, ni poseen acciones, ni reciben financiación de ninguna compañía u organización que pueda obtener beneficio de este artículo, y han declarado carecer de vínculos relevantes más allá del cargo académico citado anteriormente.
El virus del Nilo Occidental se transmite a través de la picadura de los mosquitos del género _Culex_.Jens Goepfert/Shutterstock
Durante las últimas semanas, el virus del Nilo Occidental ha vuelto a ocupar titulares en España. Andalucía y Extremadura han notificado nuevos casos humanos, varios municipios están en alerta y cuatro personas han fallecido.
No obstante, aunque el patógeno sigue circulando, la situación es muy distinta a la de 2024, cuando España registró 158 infecciones, la cifra más alta desde que se detectó por primera vez en el país. Este año, los casos apenas superan la veintena. ¿Qué ha cambiado? La respuesta está en la vigilancia y la prevención.
¿Qué sabemos del virus del Nilo Occidental?
El virus se transmite a través de la picadura de mosquitos del género Culex, que transportan el patógeno entre aves, su principal reservorio, y otras especies. Basta una picadura “equivocada” para que salte a caballos o humanos
Ciclo de transmisión del Virus del Nilo Occidental.
La mayoría de las personas infectadas no presenta síntomas o sufren un cuadro leve similar a la gripe. Sin embargo, en menos del 1 % de los casos puede afectar al sistema nervioso, causando meningitis, encefalitis o incluso la muerte.
En los últimos años, se ha consolidado como un virus endémico en Europa, especialmente en la cuenca mediterránea. El aumento de las temperaturas, los inviernos suaves y los veranos más largos han creado el entorno ideal para los mosquitos Culex. España, con amplias zonas húmedas y un clima cálido, reúne las condiciones perfectas para su expansión.
De brote local a problema nacional
Los primeros casos humanos se notificaron en 2010, en la provincia de Cádiz. Durante casi una década, la enfermedad permaneció en niveles bajos. Pero en 2020 se produjo un brote sin precedentes: 77 casos, sobre todo en Andalucía y Extremadura. Desde entonces, el virus no ha desaparecido.
En los años siguientes, la circulación se mantuvo con altibajos. Como apuntábamos antes, en 2024 fueron notificadas 158 infecciones humanas, junto con casos en aves y caballos en distintas provincias. Este año, sin embargo, el panorama ha cambiado: a 27 de octubre de 2025 se han confirmado unos 27 casos humanos, concentrados en Extremadura, y un caso leve en Andalucía, detectado gracias a vigilancia activa. Además en esta última comunidad se ha constatado circulación del virus en mosquitos del valle del Guadalquivir, como en Coria del Río, Gerena o Villamanrique de la Condesa.
El descenso de casos refleja una vigilancia constante y una mejor coordinación entre autoridades sanitarias, veterinarias y ambientales.
La vigilancia ha cambiado el rumbo
Tras los brotes de 2020, Andalucía puso en marcha el Programa de Vigilancia del Virus del Nilo Occidental, un plan pionero que combina control entomológico, seguimiento veterinario y vigilancia epidemiológica para detectar el virus antes de que llegue a las personas.
El programa emplea trampas para capturar mosquitos, analiza aves silvestres y caballos, y activa alertas cuando se detecta circulación viral. Así, las autoridades pueden intervenir con fumigaciones selectivas, eliminación de criaderos y campañas informativas.
El modelo andaluz ha sido tan eficaz, que en 2025 se ha extendido a todo el país mediante el Programa Nacional de Vigilancia de la Fiebre del Nilo Occidental, coordinado por los ministerios de Agricultura y Sanidad. Extremadura, por ejemplo, ha reforzado la instalación de trampas en humedales del río Guadiana, lo que ha permitido detectar mosquitos portadores y limitar el riesgo de transmisión.
El resultado es claro: menos contagios, menos muertes y una respuesta más rápida ante los primeros signos del virus.
El papel de la ciudadanía
La vigilancia institucional no funciona sin la colaboración ciudadana. Las comunidades afectadas han lanzado campañas con medidas sencillas: eliminar el agua estancada, mantener limpios los bebederos, usar repelentes y colocar mosquiteras.
Aunque parezcan gestos menores, su impacto es enorme. Reducir los puntos de cría de mosquitos limita su población y, con ello, la posibilidad de transmisión. En Andalucía, la mayor sensibilización de la población ha sido clave para consolidar los buenos resultados de 2025.
Porque la prevención empieza en casa. Los mosquitos Culex no viajan lejos: suelen reproducirse a menos de dos kilómetros del lugar donde nacen. Cada acción local tiene un efecto directo en la protección de toda la comunidad.
Más allá del Nilo Occidental
El caso del virus del Nilo Occidental es también una advertencia sobre los desafíos del cambio climático. Las alteraciones en temperatura y lluvias están ampliando la distribución de mosquitos vectores en Europa, favoreciendo la aparición de otros virus como el dengue o el chikungunya.
La experiencia española ofrece una lección valiosa: la detección temprana y la coordinación entre administraciones son la mejor defensa frente a estas amenazas emergentes. Pero la vigilancia no puede relajarse. El virus del Nilo no se ha ido, simplemente está mejor controlado.
España ha pasado del brote a la vigilancia, y eso marca la diferencia entre reaccionar tarde o prevenir a tiempo. Mantener ese equilibrio dependerá de que ciencia, autoridades y ciudadanía sigan trabajando juntas para contener un virus que, aunque estacional, ha venido para quedarse.
Las personas firmantes no son asalariadas, ni consultoras, ni poseen acciones, ni reciben financiación de ninguna compañía u organización que pueda obtener beneficio de este artículo, y han declarado carecer de vínculos relevantes más allá del cargo académico citado anteriormente.
Source: The Conversation – (in Spanish) – By Nuria Rey Somoza, Docente investigadora en la Facultad de Artes y Humanidades URJC, Universidad Rey Juan Carlos
En nuestro imaginario existe una idea más o menos clara de lo que es un meme. Lo asociamos al tipo de imágenes estáticas que, acompañadas por texto, circulan por foros y redes sociales con una intención humorística. Fue en esa forma cuando se popularizó el término, coincidiendo con el clímax de la vida online 2.0: pasamos de una interacción unidireccional con los entornos digitales a una expansión de las posibilidades comunicativas en internet. Esta es su era de asentamiento, que fundamenta las bases narrativas y comunicativas de las que vendrán.
Memes: objetos y procesos culturales
En su sentido originario, el meme es una unidad o conjunto de elementos culturales que da lugar a los comportamientos, gestos y costumbres. Es decir, puede ser un objeto independiente, pero también una suma que construya, de forma orgánica, interacciones socioculturales. Por ejemplo, un sticker o clip divertido de mascotas sería un meme-objeto, pero que exista todo un afán colectivo por reproducir y compartir diariamente este tipo de contenidos sería un meme-procesual.
El meme de Julio Iglesias señalando a cámara, acompañado del texto “Y lo sabes”, es un meme-objeto, mientras que el envío masivo por WhatsApp de imágenes alteradas de Julio Iglesias describiendo que llega el mes de julio sería un meme-procesual. El emoticono con pulgar hacia arriba, indicando “ok”, “me gusta” o “de acuerdo”, es un meme-objeto que forma parte de una interacción, pero su significado es un meme-procesual, pues ese sentido es aceptado por las generaciones boomers y millennials, pero las generaciones Z y alpha emplean otros iconos para expresar lo mismo.
En su devenir digital, el meme ha ido adaptándose a todos los espacios disponibles, aumentando su sentido del humor hasta el absurdo y sus nociones básicas hacia artefactos más complejos, donde la ironía queda en un segundo plano y predomina lo autorreferencial y local. Desplazando, así, su intención original de socializar experiencias universales para, ahora, interpelar a comunidades más pequeñas que articulan sus propias jergas desde lo memético viral.
Por ello, entendido como unidad o como engranaje de sentidos, el meme digital funciona como dispositivo clave de la comunicación digital, y es fundamental también para comprender el mundo actual que habitamos: un mundo-imagen, hipervisual e hiperconectado. Se cuela y configura las relaciones sociales, tecnológicas, culturales, icónicas y subjetivas que se activan en los espacios online de conexión continua.
Memes y folclore digital
En este punto, se pueden destacar algunas características principales de los memes contemporáneos. Los memes de internet son dispositivos culturales creativos y comunicativos, dinámicos y maleables, que interpretan la realidad y, al mismo tiempo, se versionan entre ellos. Su esencia, pues, se localiza en un movimiento constante, impregnando con su dinamismo cada proceso online. Si se detiene o se rechaza por parte de la comunidad, ese meme dejará de funcionar.
Son, además, artefactos intangibles, inmediatos y efímeros, pues solo “suceden” mientras se están reproduciendo. Se propagan por un mecanismo similar al boca a boca, y cuando ya están instalados en las prácticas comunicativas, se convierten en un recurso fluido y natural para la cotidianidad. Con ello, son capaces de determinar los modelos para la conversación, no solo digital, sino también de las interacciones offline. De esta manera, van combinando actos digitales, físicos, analógicos, tecnológicos, culturales y políticos en las rutinas de las comunidades.
Por ello, estos memes son parte de un patrimonio digital que ha ido creciendo según han avanzado las posibilidades tecnológicas, técnicas y artísticas entre personas y dispositivos. Existe, de este modo, un folclore digital que representa el conjunto de nuevas tradiciones, actitudes y códigos culturales que se desarrollan a través de las vidas conectadas en red.
Junto con lo anterior, el meme digital se caracteriza por su plasticidad y flexibilidad a la hora de cambiar: para adaptarse, un meme debe permitir ser recontextualizado, expandido, reinterpretado. Todo esto multiplica sus opciones para ser reconvertido en otros formatos por los usuarios, de manera orgánica y colaborativa, conscientemente o no.
Sobre todo cuando es un acto intencionado, se ponen en juego diferentes capacidades creativas que tienen que ver con las narrativas digitales, los procesos mediáticos y las interacciones lúdicas. Expresiones visuales como el collage, el pastiche o el fotomontaje (y ahora, las imágenes generadas con IA) son fórmulas que se basan en la creatividad distribuida y el remix. La creatividad distribuida se refiere a la creación colectiva o colaborativa, la cocreación, pero también a la creación desde la acumulación o fragmentación por la intervención de distintos usuarios. Es decir, modificar elementos de un meme al añadir, quitar o desplazar alguno de sus componentes para incorporar capas de significado o nuevas lecturas. Estas reconfiguraciones fomentan habilidades para la transformación y la reconstrucción de sentidos: implica experimentar con el remix de las imágenes y otras formas de expresión de los nuevos medios.
Estas prácticas de remix y versionado en red se articulan desde diferentes opciones de autoría, que se alejan de la tradicional concepción y uso de la propiedad intelectual y el reconocimiento. Lo genuino y único no existe en internet tal como lo entendíamos en épocas anteriores: ahora, el bagaje previo de un material no es solo intelectual, sino que sigue existiendo visualmente o, por lo menos, en su huella digital. La mayoría de materiales son, pues, de autoría compartida o fluida, en la que acciones como el reciclaje de elementos (copiando, pegando, ensamblando, replicando) son ya habilidades asimiladas por la sociedad actual.
El acceso y disponibilidad de herramientas creativas prometía un escenario de mayor democratización en el internet global, aunque es cierto que se ha demostrado una cultura condicionada en nuestros días. Sin embargo, sí existe cierta fusión entre alta y baja cultura cuando pueden convivir en situaciones de igualdad.
Así, las instituciones y circuitos oficiales de la cultura comparten espacios mediáticos con prácticas de arte electrónico (netart), fenómenos como los NFTs, expresiones de activismo digital, cultura visual trash (imágenes pobres, deterioradas o molestas según los cánones comunes) y aplicaciones de creación audiovisual (apps de plantillas o filtros de imagen preconfigurados, de IA o de diseño gráfico, por ejemplo).
Conflictos de hoy, propuestas de futuro
En primer lugar, cabe señalar la consolidación del meme digital hoy desde el audiovisual. De esta manera, va abandonando sus formas clásicas estáticas para manifestarse en distintos formatos de vídeo, gracias al auge y predominio de plataformas como YouTube, TikTok y sitios de streaming. Y, por ser materiales más complejos, el meme contemporáneo tiende a ser un meme-procesual, siempre a favor de la máxima viralización, abandonando también poco a poco la conexión emocional con los memes-objeto. Hay por ello una brecha entre generaciones al visualizar, interpretar y socializar estos materiales (puede verse en vídeos de creadores más jóvenes cuando revisan y señalan que los “memes antiguos” dan cringe, vergüenza ajena).
En épocas previas, el sentido de una red hiperconectada como internet se entendía desde la democratización y colaboración social. Sin embargo, algunas de las tendencias y contenidos del presente nos alertan que esto ha cambiado: la posibilidad (y el deseo) de monetizar cualquier contenido online prioriza escenarios individualistas y de jerarquización, también en las redes sociales de comunicación. Pretender convertir todo en un producto rentable o publicitario deviene en que los memes estén al servicio del algoritmo.
De esta manera, fórmulas que antes se entendían como populares han sido manipuladas por las corporaciones y la tecno-élite: lo vemos en hilos de comentarios llenos de bots, en la repetición de anuncios en bucle, en el embarramiento de la experiencia del usuario en redes o en el uso de bulos e imágenes IA con fines de espectacularización ideológica. Por ello, los componentes del patrimonio digital se van convirtiendo en objetos y procesos más homogéneos y previsibles.
En contraposición, tanto los memes como otros recursos para la comunicación digital nos pueden servir en la ideación y construcción de nuevas tendencias comunitarias online. Como tareas para ello, debemos experimentar modos de acompañamiento y cuestionamiento de las imágenes autogeneradas, de nuestra dependencia de ciertos espacios corporativos y de los usos de nuestros datos. Un ejemplo de este tipo sería el Fediverso, que se propone como un conjunto de redes sociales descentralizadas e interconectadas, externas a la dirección de las grandes empresas tecnológicas actuales. Este tipo de iniciativas se presentan como espacios de reconquista para volver a conectar con valores populares en un internet para todas las personas.
When people with mental health problems are in crisis, police often are the first responders. Since many officers have little to no training on how to assess or treat mental illness, these situations can easily become violent.
In 2024, for example, 118 people were killed across the U.S. after police responded to reports of someone having a mental health episode. Such cases can lead to charges of police brutality.
This problem is not new. One of the first cases to receive wide attention and spur reform efforts happened 41 years ago, on Oct. 29, 1984. On that day, a white New York City police officer fatally shot 66-year-old Eleanor Bumpurs, a Black woman. Bumpurs, who lived in public housing and had a history of mental health problems, was killed during an eviction.
Bumpurs’ death ignited one of New York’s most significant social justice campaigns of the 1980s, centering on Black women’s encounters with police. It influenced decades of debate over police response to those with mental illness, which have continued right up to New York City’s current mayoral election.
On the day of the shooting, officers from the New York City Police Department’s Emergency Service Unit and the city housing agency gathered with a city marshal, public housing and welfare workers and medical technicians outside Bumpurs’ apartment. They were there to evict Bumpurs, who was four months behind on her rent and owed the city a little over US$400, equivalent to about $1,240 in today’s dollars. Housing Authority policy required police to accompany city marshals to all evictions.
As I recount in my book, this group believed Bumpurs was violent. Housing officers told the police that she was mentally ill and had a history of throwing lye on strangers.
While Bumpurs had a history of mental illness, she was also an elderly woman in need of medical care. As The New York Times editorial board later pointed out:
“… neither the city’s Housing Authority nor Human Resources Administration seemed able to help. Officials were unable to secure an emergency rent grant, for which she would have easily qualified. A consulting psychiatrist found her unable to function and recommended hospitalization, but no one moved fast enough.”
The officers were tasked with subduing Bumpurs. They had little information about her underlying condition or training to manage it.
Armed with gas masks, plastic shields, a restraining bar and a shotgun, six officers entered Bumpurs’ apartment. Police observed Bumpurs wielding a butcher knife in her right hand. Officer Stephen Sullivan fired two blasts with the shotgun. The first severely damaged Bumpurs’ right hand; the second struck her in the chest. Bumpurs died at a local hospital.
Paton Blough, who has bipolar disorder that triggers delusions, explains what it’s like to be arrested during a mental illness episode.
Public outrage
Bumpurs’ killing shocked New Yorkers. City leaders and community activists condemned what they saw as the NYPD’s use of excessive force against Black people and other people of color, particularly those with mental health conditions.
Bumpurs’ killing was discussed in Sunday morning sermons, university lecture halls, beauty salons and barbershops. Many New Yorkers denounced the shooting, although others praised Sullivan for protecting the lives of his fellow officers.
Artists took up Bumpurs’ cause. In her 1986 poem “For the Record: In Memory of Eleanor Bumpers,” Audre Lorde wrote:
 Who will count the big fleshy women
 the grandmother weighing 22 stone
 with the rusty braids
 and gap-toothed scowl
 who wasn’t afraid of Armageddon
 . . . .
 and I am going to keep writing it down
 how they carried her body out of the house
 dress torn up around her waist
 uncovered
 past tenants and the neighborhood children
 a mountain of Black Woman
 and I am going to keep telling this
 if it kills me
 and it might in ways I am
 learning
In 1989, Brooklyn filmmaker Spike Lee dedicated his movie “Do the Right Thing” to Bumpurs and other Black New Yorkers killed by police officers.
Critics argued that Sullivan should be terminated and charged with homicide. They called for holding city workers responsible for mishandling the eviction and pressed Mayor Edward Koch and U.S. Attorney Rudolph Guiliani to investigate it.
Through rallies, grassroots lobbying and letter-writing campaigns, activists demanded legal justice for Bumpurs. They also called for reforms, including new police policies.
Amid activists’ calls for his arrest, Sullivan said he had been justified in shooting Bumpurs. He insisted that he had followed police procedures.
City action
In response to Bumpurs’ death, the NYPD implemented new procedures. Public pressure from activists inspired policy changes.
Officers were instructed not to confront “an emotionally disturbed person believed to be armed or violent. No action will be taken until the Precinct Commander or Duty Captain arrives and evaluates the situation.”
The new policies prioritized nonlethal methods for responding to these emergencies, instructing officers to use nets, Tasers and restraining bars and shields rather than guns.
Even as the NYPD has adopted various training programs, people with mental illnesses continue to face excessive and deadly force when they confront the police.
Protesters in New York City demonstrate over police violence against Black people, including Eric Garner and Michael Brown, who were both killed by police in 2014. Viviane Moos/Corbis via Getty Images
Nonetheless, New Yorkers continued to confront police violence. On Oct. 18, 2016, police Sgt. Hugh Barry responded to reports that 66-year-old Deborah Danner, who was schizophrenic, had been screaming in the halls of her Bronx apartment building. Barry, who had not received CIT training, fatally shot Danner when she allegedly swung a bat at him. Barry was later indicted and acquitted of murder in 2018.
The B-Heard program dispatches mental health professionals and fire department paramedics to 911 mental health calls. As of 2024, however, it covered only 31 out of 77 NYPD precincts. Police officers still respond to many mental health calls using Tasers or firearms.
On March 27, 2024, for example, 19-year-old Queens resident Win Rozario called 911 because he was experiencing a mental health episode. Since no B-Heard unit served Rozario’s neighborhood, police were dispatched. Rozario was fatally shot minutes after officers entered his home.
More than a dozen U.S. cities are increasingly responding to nonviolent mental health crises with clinicians and EMTs or paramedics instead of police.
Research shows that such initiatives are safer and more effective than relying on law enforcement interventions. They produce better outcomes for people with mental health conditions and help keep communities safer.
In interviews with Bumpurs’ daughter, Mary, I asked what she saw as the legacy of her mother’s case.
She replied, “To keep her spirit moving. To let people know what happened to her.”
More than 40 years after Bumpurs’ death, the public continues to remember her death. Activists and writers have paid tributes and written articles about Bumpurs, signaling the importance of her tragic killing to the current political movement against police violence.
LaShawn Harris does not work for, consult, own shares in or receive funding from any company or organization that would benefit from this article, and has disclosed no relevant affiliations beyond their academic appointment.
What would you say if you were told that paranormal activity exists? Well, nearly half of Canadians would agree.
What is the paranormal, exactly? It refers to phenomena that science cannot explain and are not part of a major religion in a particular society. In contrast, religious phenomena are part of an established doctrine. For example, in Canada, psychic abilities and Bigfoot or Sasquatch are considered paranormal, while angels and demons are associated with religion.
In the summer of 2025, we launched a survey of Canadian attitudes regarding paranormal beliefs in which participation was confidential. And for the first time in decades, we have nationally representative data on paranormal beliefs and encounters in Canada.
Although news outlets regularly publish stories about paranormal beliefs on Halloween, the results they discuss are usually based on convenience samples. Ours is the first study in 20 years to use randomly selected people from the Canadian population to ask these questions — meaning the results are representative.
And it turns out that almost one in two Canadians believe in at least one paranormal phenomenon, and one-quarter report encounters with spirits.
We asked about ghostly hauntings, alien visitations, psychic abilities, telekinesis, astrology and other unexplained phenomena. We also asked about cryptids — animals or creatures whose existence has been suggested but not (yet) proven by science — specific to Canada. They include creatures with roots in First Nations folklore like the large serpentine sea monster, the Cadborosaurus, off the B.C. coast and the Ogopogo in Lake Okanagan.
How Canadians think about the paranormal, however, has been mostly unknown. It’s expensive to gather representative data in Canada and few social scientists think it’s important to study belief in the paranormal. The combination of these two factors has meant Canadian paranormal beliefs have gone unexamined for decades.
What we found is that Canadians have embraced the paranormal — to a point.
Almost half — 44 per cent — believe in at least one paranormal phenomenon. About one-third did not report belief in any paranormal phenomenon but did indicate neutrality about at least one. For example, several respondents did not believe in ghosts, but were on the fence about extraterrestrial visitations.
Many non-probability samples of Canadians have been surveyed over the last few years, but unlike ours, those results tell us little because they did not use random sampling to recruit respondents. This graph shows how many Canadians believe, are neutral or don’t believe in the existence of paranormal activity. (Sophia Dimitrakopoulos), CC BY-ND
Only about one-quarter said they did not believe in any of the 10 phenomena we asked about. The percentage of firm non-believers is similar to the 28 per cent figure in the United States and the United Kingdom Belief varied by specific phenomenon. People were most likely to believe in ghostly hauntings.
Respondents answered the authors’ survey on a granular lever, revealing whether they neither disagree nor agree, somewhat agree or strongly agree with whether each type of 10 paranormal phenomenon exists or not. (Sophia Dimitrakopoulos), CC BY-ND
Overall, it is more common for Canadians to believe in at least one paranormal phenomenon than to not believe in any.
Who is most likely to believe?
Patterns of belief vary somewhat by demographic group.
Women are more likely than men to believe in ghosts and psychics, reflecting how women have a higher probability of being open to phenomena with a spiritual dimension.
People with bachelor’s degrees or higher are less likely to believe in most paranormal phenomena. There are few racial or ethnic differences.
Interestingly, people aged 19-29 are less likely to believe in many paranormal phenomena than those aged 30-44 or 45-64. These findings suggest that young Canadians tend to opt out of any non-scientific belief system, whether religious or paranormal.
Few differences by region or language exist, though Francophones are less likely to believe in Sasquatch than Anglophones are.
Paranormal experiences in Canada
About one-quarter of Canadians claim to have heard, seen or felt a ghost or spirit. Some experiences were connected to religion, such as feeling the Christian Holy Spirit.
More often, experiences were associated with the death of a loved one and were personally meaningful. As one participant explained: “Soon after my mother’s death, I woke up suddenly and she was standing beside my bed. She smiled at me and faded away. I was comforted.”
Others reported spooky encounters associated with a place. A different participant wrote: “I was managing a motel and saw a ghostly man walking along the upper balcony. I asked the locals, and they said on the property that the motel was on, there was a house that burned down — and he lived in the house!”
Cryptid sightings are less common.
“I was operating a high-clearance sprayer, in a 1,300-acre field. I sat about 10 feet in the air in the cab on this machine,” one participant said. “I came around the corner of a bluff and saw a blurry, bipedal creature. It was furry, had a long snout and long arms, and in an instant turned into a moose. I have no idea to this day what that was.”
What our beliefs reveal
Our goal is not to prove or disprove any experience or belief, but to analyze what they mean for individuals and for Canada.
And to that end, our survey showed us that while many Canadians have replaced or supplemented religious belief with paranormal belief, most trust science. Belief in the paranormal or religion does not mean Canadians reject science, but rather that they believe some phenomena cannot yet be explained by science.
While the paranormal is fun — or creepy — to think about around Halloween, it is also part of the everyday belief system of many Canadians.
Tony Silva (as co-applicant) received funding from the Social Sciences and Humanities Research Council of Canada for the first survey wave of this project, which focused on attitudes about politics and decarbonisation. No grant or taxpayer funds were used for the second survey wave, which included questions about paranormal beliefs.
Emily Huddart received funding from the Social Sciences and Humanities Research Council of Canada to support an earlier wave of this project (with Tony Silva).
Source: The Conversation – (in Spanish) – By Martalu D Pazos, Investigadora predoctoral en neuropsicofarmacología de derivados anfetamínicos y otras nuevas sustancias psicoactivas del Departamento de Farmacología, Toxicología y Química Terapéutica, Universidad de Barcelona., Universitat de Barcelona
¿Imagina poder comprar una droga por internet y que llegue a su casa por correo? Pues la opción existe. Y no es una sola, sino cientos. Se trata de las llamadas nuevas sustancias psicoactivas (NPS), y su presencia no para de aumentar.
Estas sustancias se crean con un objetivo muy claro: imitar los efectos de otras drogas más conocidas, como el cannabis, la cocaína, el éxtasis (MDMA) o la LSD, pero modificando ligeramente su estructura química para esquivar las leyes existentes. Que sean “legales” puede dar una falsa sensación de seguridad, pero nada más lejos de la realidad: se trata de sustancias poco investigadas sobre las que la información de seguridad es, en gran parte, desconocida. Este fenómeno es difícil de controlar porque cambia constantemente: cuando una se prohíbe, ya hay varias sustancias nuevas listas para reemplazarla.
El narcotráfico se digitaliza
Comprar drogas fiscalizadas implica, normalmente, conocer a alguien en el barrio que las tenga y las venda, es decir, “trapichear” y exponerse tanto a problemas legales como a situaciones de riesgo. Aunque existen maneras de adquirirlas por internet de forma más anónima y segura, esto conlleva saber acceder a la internet profunda o deep web y manejar criptomonedas.
Sin embargo, con las NPS la cosa cambia. Al no ser ilegales, cualquiera puede adquirirlas fácilmente online. Basta con una tarjeta de crédito y una dirección, como si fuera cualquier otro producto, y nos la envían a domicilio. Para ello, se utilizan los servicios postales o los sistemas de logística internacional. En el etiquetado se imprime la advertencia “no apto para consumo humano” o algo cotidiano como “sales de baño”.
Sales de baño
A la cocaína, la anfetamina y la MDMA en estos momentos les hace la competencia un grupo de sustancias que las imitan: las llamadas catinonas sintéticas o “sales de baño”. Son los estimulantes modernos más populares en España y han venido para quedarse.
Dentro de esta familia, la más popular es la mefedrona, que comenzó a venderse por internet en 2007 como MDMA legal. Sus efectos de euforia, mayor apreciación por la música, empatía y una leve estimulación sexual la llevaron a popularizarse en las noches de fiesta. Además, la duración de sus efectos es más corta, lo que invita a consumir repetidamente durante la misma sesión, aumentando los riesgos. Tras su prohibición, el ritmo de aparición de nuevas catinonas que cubrieran su nicho de mercado ha sido elevado.
Las drogas de los festivales
¿Qué pasó hace un año en el Primavera Sound de Barcelona? Con la llegada del buen tiempo, suelen aflorar los festivales de música. Y no es raro que, además del alcohol y el tabaco, los asistentes también busquen una pasti para “mejorar la experiencia”. Las más habituales en estos contextos suelen ser las de MDMA. Por desgracia, en un mercado desregulado como el de las drogas ilegales, estas pastillas no cuentan con los controles de calidad que sí tienen las drogas legales o medicamentos. Eso hace que el fraude en cantidad o composición de la droga sea una práctica extendida en el narcotráfico para abaratar costes, potenciar efectos o eludir consecuencias legales.
Esto ocurrió el año pasado en el Primavera Sound de Barcelona, uno de los festivales más importantes de España. Una pastilla de color rosa y forma cuadrada se vendía como si fuera MDMA. Pero al analizarla en el servicio estacionario de Energy Control, se descubrió que contenía clefedrona, una catinona sintética que la imita. Esto significa que se podría haber consumido una nueva droga sin saberlo, lo que aumenta los riesgos para la salud.
Más allá del tabú: hablar de drogas para salvar vidas
El consumo de estimulantes crece cada año y con él, también su producción. Así, las catinonas se consolidaron en el mercado para satisfacer una creciente demanda global cada vez más establecida.
Cuando hablamos de los peligros de las drogas, solemos pensar solo en la adicción. Sin embargo, la realidad es mucho más amplia. Incluso si no nos hacemos adictos, consumir puede afectar a nuestra salud física y mental, impactar en el trabajo o los estudios, afectar a las relaciones personales y a la económica, entre otros problemas.
La forma más segura de evitar los riesgos del consumo de drogas es no consumirlas. Pero si se decide tomarlas, es crucial conocer los riesgos y tener información sobre cómo reducirlos, porque nadie sale de fiesta pensando en acabar en urgencias. La información salva vidas.
La paradoja de la prohibición
Las políticas basadas únicamente en la prohibición no logran reducir el consumo, el tráfico o los daños asociados. De hecho, pueden tener el efecto contrario: favorecen la aparición de nuevas sustancias diseñadas para esquivar la ley, pero sobre las que sabemos aún menos. Esto incrementa los riesgos para la salud de quienes las consumen.
Por eso, es necesario romper el tabú y hablar de drogas. No se trata de fomentar su consumo, sino de reconocer una realidad y apostar por estrategias basadas en la prevención, la reducción de daños y, en algunos casos, la regulación de ciertas sustancias sobre las que ya hay un conocimiento científico y médico sólido.
Martalu D. Pazos recibe financiación a través de una beca de doctorado concedida por la Generalitat de Catalunya (AGAUR), 2023 FISDU 00182. Desde el año 2022, es voluntaria en el programa Energy Control de reducción de riesgos en consumos recreativos de drogas de la organización sin ánimo de lucro ABD – Asociación Bienestar y Desarrollo.
David Pubill Sánchez no recibe salario, ni ejerce labores de consultoría, ni posee acciones, ni recibe financiación de ninguna compañía u organización que pueda obtener beneficio de este artículo, y ha declarado carecer de vínculos relevantes más allá del cargo académico citado.
When it comes to setting monetary policy for the world’s largest economy, what data drives decision-making?
In ordinary times, Federal Reserve Chair Jerome Powell and voting members of the Federal Open Market Committee, which usually meets eight times a year, have a wealth of information at their disposal, including key statistics such as monthly employment and extensive inflation data.
But with the federal shutdown that began Oct. 1, 2025, grinding on, government offices that publish such information are shuttered and data has been curtailed. Now, Powell and his Fed colleagues might be considering the price of gas or changes in the cost of coffee as they meet on Oct. 29 to make a judgment on the strength of the U.S. economy and decide where to take interest rates.
The Federal Reserve’s mandate is to implement monetary policy that stabilizes prices and promotes full employment, but there is a delicate balance to strike. Not only do Powell and the Fed have to weigh domestic inflation, jobs and spending, but they must also respond to changes in President Donald Trump’s global tariff policy.
But, fortunately, the Fed’s not flying blind – it still has a wide range of private, internal and public data to help it read the pulse of the U.S. economy.
Torsten Slok, chief economist for the Apollo asset management firm, recently released his set of “alternative data,” capturing information from a wide range of sources. This includes ISM PMI reports, which measure economic activity in the manufacturing and services sectors, and Bloomberg’s robust data on consumer spending habits.
“Generally, the private data, the alternative data that we look at is better used as a supplement for the underlying governmental data, which is the gold standard,” Powell said in mid-October. “It won’t be as effective as the main course as it would have been as a supplement.”
But at this crucial juncture, the Fed has also abruptly lost one important source of private data. Payroll processor ADP had previously shared private sector payroll information with the central bank, which considered it alongside government employment figures. Now, ADP has suspended the relationship, and Powell has reportedly asked the company to quickly reverse its decision.
With some key data unavailable, the Fed may pay more attention to the price of a cup of coffee to help determine how to set interest rates. AP Photo/Julio Cortez
Internal research
Fortunately for the Fed, it has its own sources for reliable information.
Since the Fed is self-funded, the government shutdown didn’t stop it from publishing its Beige Book, which comes out eight times a year and provides insight into how various aspects of the economy are performing.
Its Oct. 15 report found that consumer spending had inched down, with lower- and middle-income households facing “rising prices and elevated economic uncertainty.” Manufacturing was also hit by challenges linked to higher tariffs.
According to the most recent consumer confidence reports, Americans are significantly more worried about their jobs over the next six months, as compared to this time last year, and expect fewer employment opportunities during that period. This suggests the Fed will likely see an uptick in the unemployment rate, once the data resumes publishing.
And if you did notice an increase in the price of your morning coffee, you’re not mistaken – both private and market-based data suggest inflation is a pressing concern, with expectations that price increases will remain at about the 2% target set by the Fed.
It’s clear that there is no risk-free path for policy, and a wrong move by the Fed could stoke inflation or even send the U.S. economy spiraling into a recession.
Uncertain path ahead
At the Fed’s September monetary policy meeting, members voted to cut benchmark interest rates by 25 basis points, while one member advocated for a 50-point cut.
It was the first interest rate cut since December – one that Trump had been loudly demanding to help spur the U.S. economy and lower the cost of government debt. Markets expect the Fed to cut interest rates by another quarter of a percentage point at its Oct. 28-29 meeting and then again in December. That would lower rates to a range of 3.5% to 3.75%, from 4% to 4.25% currently, giving the labor market a much-needed boost.
After that, the near-certainty ends, as it’s anyone’s guess where interest rates will go from there. At quarterly meetings, members of the Federal Open Market Committee give projections of where they think the Fed’s benchmark interest rate will go over the next three years and beyond to provide forward guidance to financial markets and other observers.
The median projection from the September meeting suggests the benchmark rate will end 2026 a little lower than where it began, at 3.4%, and decline to 3.1% by the end of 2027. With inflation accelerating, Fed officials will continue to weigh the weakening labor market against the threat of inflation from tariffs, immigration reform and their own lower interest rates – not to mention the ongoing impact of the government shutdown.
Unfortunately, I believe these risks will be difficult to mitigate with just Fed intervention, even with perfect foresight into the economy, and will need help from government immigration, tax and spending policy to put the economy on the right path.
Jason Reed does not work for, consult, own shares in or receive funding from any company or organization that would benefit from this article, and has disclosed no relevant affiliations beyond their academic appointment.
The ability to make art has often been considered a hallmark of our species. Over a century ago, prehistorians even had trouble believing that modern humans from the Upper Palaeolithic (between 45,000 and 12,000 years ago) were capable of artistic flair.
Discoveries of uncontrovertibly old artworks from the caves and rockshelters of Europe soon dispelled their doubts. But what of the Neanderthals; an ancient, large-brained sister group to our own species? We now know that they were capable of making art too.
However, at present, all of the Neanderthal evidence is non-figurative – they have no depictions of animals, including humans. This latter form of art was perhaps exclusive to Homo sapiens. Instead, the Neanderthal examples consist of hand stencils, made by blowing pigment over the hand, finger flutings – where the fingers were pressed into a soft surface – and geometric markings.
Neanderthals inhabited western Eurasia from about 400,000 years ago until their extinction about 40,000 years ago and have often been caricatured as the archetypal “cavemen”.
Questions about their cognitive and behavioural sophistication have never quite gone away, and whether they produced art is at the forefront of this issue.
Despite the fact that we know that Neanderthals were capable of producing jewellery and using coloured pigments, there has been much objection to the notion that they explored deep caves and left art on the walls.
But recent work has confirmed beyond doubt that they did. In three Spanish caves – La Pasiega in Cantabria, Maltravieso in Extremadura and Ardales in Malaga, Neanderthals created linear signs, geometric shapes, hand stencils, and handprints using pigments. In La Roche Cotard, a cave in the Loire Valley, France, Neanderthals left a variety of lines and shapes in finger flutings (the lines that fingers leave on a soft surface).
And deep in the Bruniquel cave, southwest France, they broke off stalactites into sections of similar length and constructed a large oval wall of them, setting fires on top of it. This was not a shelter but something odder, and if it was constructed in a modern art gallery we’d no doubt assume it was installation art.
Now that we have well-established examples of Neanderthal art on cave walls in France and Spain, more discoveries are inevitable. However, the job is hard because of difficulties in establishing the age of Palaeolithic cave art. In fact, it is often the focus of intense debate among specialists.
Relative dating schemes based on the style and themes of cave art and comparisons of objects recovered from dated archaeological levels have proven useful, but they have their limits.
To produce real ages requires at least one of three conditions. The first is the presence of a charcoal pigment which can be dated using the radiocarbon method. This will establish exactly when the charcoal was created (when its wood died). However, black pigments are often from minerals (manganese) and therefore a large amount of black coloured cave art is simply not dateable.
A further problem is that the production of the charcoal may or may not be of the same age as the date that it was used as a pigment. I could pick up some 30,000-year-old charcoal from a cave floor and write “Paul was here” on a cave wall. The radiocarbon date wouldn’t reflect when my grafitto was actually made.
A second condition is the presence of calcite flowstones (stalactites and stalacmites) that have formed over the art. If they demonstrably grew on top of a piece of art, then they must be younger than it. A dating method based on the decay of uranium into an isotope – a particular form – of the element thorium can be used to establish exactly when flowstones formed, producing a minimum age for the art underneath.
I was part of a team who used this method to date flowstones overlying red pigment art in the three Spanish caves mentioned earlier, demonstrating that hand stencils, dots and colour washes must have been created over 64,000 years ago. This is a minimum age: the actual age of the images could be much older.
But even at its youngest range, the images predate the earliest arrival of modern humans (Homo sapiens) in Iberia by at least 22,000 years. As Middle Palaeolithic archaeology – the calling cards of the Neanderthals – is common in all three caves, the simplest interpretation that fits the dating is that the authors of the images were Neanderthals.
Objections to our results ignored supporting information we’d published. Did the dated samples really overlie the art? They did. Can we trust the technique? We have for half a century.
The third condition has just provided further evidence of Neanderthal artistic activity. Meandering lines left by tracing fingers along the soft muds of the walls of the Roche Cotard cave reveal another form of interacting with this mysterious subterranean realm. These markings include wavy, parallel and curved lines in organised arrangements that show they were made deliberately.
The dating of sediments which formed over its entrance show that it was completely sealed no later than 54,000 years ago – probably earlier. As with our Spanish examples, this was long before Homo sapiens arrived in the region and the cave contains only tools made by Neanderthals. It adds another art form to the Neanderthal repertoire.
Even ardent sceptics must agree that this data unambiguously reveal artistic activities in deep caves which can only have been made by Neanderthals.
The art could represent Neanderthal individuals becoming more aware of their own agency in the world. It might constitute the first evidence of engagement with an imaginary realm. The coming years will no doubt reveal even more subjects for debate.
Paul Pettitt does not work for, consult, own shares in or receive funding from any company or organisation that would benefit from this article, and has disclosed no relevant affiliations beyond their academic appointment.
For nearly four centuries, the world economy has been on a path of ever-greater integration that even two world wars could not totally derail. This long march of globalisation was powered by rapidly increasing levels of international trade and investment, coupled with vast movements of people across national borders and dramatic changes in transportation and communication technology.
According to economic historian J. Bradford DeLong, the value of the world economy (measured at fixed 1990 prices) rose from US$81.7 billion (£61.5 billion) in 1650, when this story begins, to US$70.3 trillion (£53 trillion) in 2020 – an 860-fold increase. The most intensive periods of growth corresponded to the two periods when global trade was rising fastest: first during the “long 19th century” between the end of the French revolution and start of the first world war, and then as trade liberalisation expanded after the second world war, from the 1950s up to the 2008 global financial crisis.
Now, however, this grand project is on the retreat. Globalisation is not dead yet, but it is dying.
Is this a cause for celebration, or concern? And will the picture change again when Donald Trump and his tariffs of mass disruption leave the White House? As a longtime BBC economics correspondent who was based in Washington during the global financial crisis, I believe there are sound historical reasons to worry about our deglobalised future – even once Trump has left the building.
The Insights section is committed to high-quality longform journalism. Our editors work with academics from many different backgrounds who are tackling a wide range of societal and scientific challenges.
Trump’s tariffs have amplified the world’s economic problems, but he is not the root cause of them. Indeed, his approach reflects a truth that has been emerging for many decades but which previous US administrations – and other governments around the world – have been reluctant to admit: namely, the decline of the US as the world’s no.1 economic power and engine of world growth.
In each era of globalisation since the mid-17th century, a single country has sought to be the clear world leader – shaping the rules of the global economy for all. In each case, this hegemonic power had the military, political and financial power to enforce these rules – and to convince other countries that there was no preferable path to wealth and power.
But now, as the US under Trump slips into isolationism, there is no other power ready to take its place and carry the torch for the foreseeable future. Many people’s pick, China, faces too many economic challenges, including its lack of a truly international currency – and as a one-party state, nor does it possess the democratic mandate needed to gain acceptance as the world’s new dominant power.
While globalisation has always produced many losers as well as winners – from the slave trade of the 18th century to displaced factory workers in the American Midwest in the 20th century – history shows that a deglobalised world can be an even more dangerous and unstable place. The most recent example came during the interwar years, when the US refused to take up the mantle left by the decline of Britain as the 19th century’s hegemonic global power.
In the two decades from 1919, the world descended into economic and political chaos. Stock market crashes and global banking failures led to widespread unemployment and increasing political instability, creating the conditions for the rise of fascism. Global trade declined sharply as countries put up trade barriers and started self-defeating currency wars in the vain hope of giving their countries’ exports a boost. On the contrary, global growth ground to a halt.
A century on, our deglobalising world is vulnerable again. But to chart whether this means we are destined for a similarly chaotic and unstable future, we first need to explore the birth, growth and reasons behind the imminent demise of this extraordinary global project.
French model: mercantilism, money and war
By the mid-1600s, France had emerged as the strongest power in Europe – and it was the French who developed the first overarching theory of how the global economy could work in their favour. Nearly four centuries later, many aspects of “mercantilism” have been revived by Trump’s US playbook, which could be entitled How To Dominate the World Economy by Weakening Your Rivals.
France’s version of mercantilism was based on the idea that a country should put up trade barriers to limit how much other countries could sell to it, while boosting its own industries to ensure that more money (in the form of gold) came into the country than left it.
England and the Dutch Republic had already adopted some of these mercantilist policies, establishing colonies around the globe run by powerful monopolistic trading companies. In contrast to these “seaborne empires”, the much larger empires in the east such as China and India had the internal resources to generate their own revenue, meaning international trade – although widespread – was not critical to their prosperity.
But it was France which first systematically applied mercantilism across the whole of government policy – led by the powerful finance minister Jean-Baptiste Colbert (1661-1683), who had been granted unprecedented powers to strengthen the financial might of the French state by King Louis XIV. Colbert believed trade would boost the coffers of the state and strengthen France’s economy while weakening its rivals, stating:
It is simply, and solely, the absence or abundance of money within a state [which] makes the difference in its grandeur and power.
In Colbert’s view, trade was a zero-sum game. The more France could run a trade surplus with other countries, the more gold bullion it could accumulate for the government and the weaker its rivals would become if deprived of gold. Under Colbert, France pioneered protectionism, tripling its import tariffs to make foreign goods prohibitively expensive.
At the same time, he strengthened France’s domestic industries by providing subsidies and granting them monopolies. Colonies and government trading companies were established to ensure France could benefit from the highly lucrative trade in goods such as spices, sugar – and slaves.
Colbert oversaw the expansion of French industries into areas like lace and glass-making, importing skilled craftsmen from Italy and granting these new companies state monopolies. He invested heavily in infrastructure such as the Canal du Midi, and dramatically increased the size of France’s navy and merchant marine to challenge its British and Dutch rivals.
Global trade at this time was highly exploitative, involving the forced seizure of gold and other raw materials from newly discovered lands (as Spain had been doing with its conquests in the New World from the late 15th century). It also meant benefiting from the trade in humans, with huge profits as slaves were seized and sent to the Caribbean and other colonies to produce sugar and other crops.
In this era of mercantilism, trade wars often led to real wars, fought across the globe to control trade routes and seize colonies. Following Colbert’s reforms, France began a long struggle to challenge the overseas empires of its maritime rivals, while also engaging in wars of conquest in continental Europe.
France initially enjoyed success in the 17th century both on land and sea against the Dutch. But ultimately, its state-run French Indies company was no rival to the ruthless, commercially driven activities of the Dutch and British East India companies, which delivered enormous profits to their shareholders and revenues for their governments.
Indeed, the huge profits made by the Dutch from the Far Eastern spice trade explains why they had no hesitation in handing over their small North American colony of New Amsterdam, in return for expelling the British from a small toehold of one of their spice islands in what is now Indonesia. In 1664, that Dutch outpost was renamed New York.
After a century of conflict, Britain gradually gained ascendancy over France, conquering India and forcing its great rival to cede Canada in 1763 after the Seven Years war. France never succeeded in fully countering Britain’s naval strength. Resounding defeats by fleets led by Horatio Nelson in the early 19th century, coupled with Napoleon’s defeat at Waterloo by a coalition of European powers, marked the end of France’s time as Europe’s hegemonic power.
The battle of Trafalgar, off southwestern Spain in October 1805, was decisive in ending France’s era of dominance. Yale Center for British Art/Wikimedia
But while the French model of globalisation ultimately failed in its attempt to dominate the world economy, that has not prevented other countries – and now President Trump – from embracing its principles.
France found that tariffs alone could not sufficiently fund its wars nor boost its industries. Its broad version of mercantilism led to endless wars that spread around the globe, as countries retaliated both economically and militarily and tried to seize territories.
More than two centuries later, there is an uncomfortable parallel with what the results of Trump’s endless tariff wars might bring, both in terms of ongoing conflict and the organisation of rival trade blocs. It also shows that more protectionism, as proposed by Trump, will not be enough to revive the US’s domestic industries.
British model: free trade and empire
The ideology of free trade was first spelled out by British economists Adam Smith and David Ricardo, the founding fathers of classical economics. They argued trade was not a zero-sum game, as Colbert had suggested, but that all countries could mutually benefit from it. According to Smith’s classic text, The Wealth of Nations (1776):
If a foreign country can supply us with a commodity cheaper than we ourselves can make, better buy it off them with some part of the produce of our own industry, employed in such a way that we have some advantages.
As the world’s first industrial nation, by the 1840s Britain had created an economic powerhouse based on the new technologies of steam power, the factory system, and railroads.
Smith and Ricardo argued against the creation of state monopolies to control trade, proposing minimal state intervention in industry. Ever since, Britain’s belief in the benefits of free trade has proved stronger and more long-lasting than any other major industrial power – more deeply embedded in both its politics and popular imagination.
This ironclad commitment was born out of a bitter political struggle in the 1840s between manufacturers and landowners over the protectionist Corn Laws. The landowners who had traditionally dominated British politics backed high tariffs, which benefited them but resulted in higher prices for staples like bread. The repeal of the Corn Laws in 1846 upended British politics, signalling a shift of power to the manufacturing classes – and ultimately to their working-class allies once they gained the right to vote.
An Anti-Corn Law League meeting held in London’s Exeter Hall in 1846. Wikimedia
In time, Britain’s advocacy of free trade unleashed the power of its manufacturing to dominate global markets. Free trade was framed as the way to raise living standards for the poor (the exact opposite of President Trump’s claim that it harms workers) and had strong working-class support. When the Conservatives floated the idea of abandoning free trade in the 1906 general election, they suffered a devastating defeat – the party’s worst until 2024.
As well as trade, a central element in Britain’s role as the new global hegemonic power was the rise of the City of London as the world’s leading financial centre. The key was Britain’s embrace of the gold standard which put its currency, the pound, at the heart of the new global economic order by linking its value to a fixed amount of gold, ensuring its value would not fluctuate. Thus the pound became the worldwide medium of exchange.
This encouraged the development of a strong banking sector, underpinned by the Bank of England as a credible and trustworthy “lender of last resort” in a financial crisis. The result was a huge boom in international investment, opening access to overseas markets for British companies and individual investors.
In the late 19th century, the City of London dominated global finance, investing in everything from Argentinian railways and Malaysian rubber plantations to South African gold mines. The gold standard became a talisman of Britain’s power to dominate the world economy.
The pillars of Britain’s global economic dominance were a highly efficient manufacturing sector, a commitment to free trade to ensure its industry had access to global markets, and a highly developed financial sector which invested capital around the world and reaped the benefits of global economic development. But Britain also did not hesitate to use force to open up foreign markets – for example, during the Opium Wars of the 1840s, when China was compelled to open its markets to the lucrative trade in opium from British-owned India.
By the end of the 19th century, the British empire incorporated one quarter of the world’s population, providing a source of cheap labour and secure raw materials as well as a large market for Britain’s manufactured goods. But that was still not enough for its avaricious leaders: Britain also made sure that local industries did not threaten its interests – by undermining the Indian textile industry, for example, and manipulating the Indian currency.
In reality, globalisation in this era was about domination of the world economy by a few rich European powers, meaning that much global economic development was curtailed to protect their interests. Under British rule between 1750 and 1900, India’s share of world industrial output declined from 25% to 2%.
But for those at the centre of Britain’s global formal and informal empire, such as the middle-class residents of London, this was a halcyon time – as economist John Maynard Keynes would later recall:
For middle and upper classes … life offered, at a low cost and with the least trouble, conveniences, comforts and amenities beyond the compass of the richest and most powerful monarchs of other ages. The inhabitant of London could order by telephone, sipping his morning tea in bed, the various products of the whole Earth, in such quantity as he might see fit, and reasonably expect their early delivery upon his doorstep.
US model: protectionism to neoliberalism
While Britain enjoyed its century of global dominance, the United States embraced protectionism for longer after its foundation in 1776 than all other major western economies.
The introduction of tariffs to protect and subsidise emerging US industries had first been articulated in 1791 by the fledgling nation’s first treasury secretary, Alexander Hamilton – Caribbean immigrant, founding father and future subject of a record-breaking musical. The Whig party under Henry Clay and its successor, the Republican Party, were both strong supporters of this policy for most of the 19th century. Even as US industry grew to overshadow all others, its government maintained some of the highest tariff barriers in the world.
Founding father Alexander Hamilton on the front of a US$10 note from 1934. Wikimedia
Tariff rates rose to 50% in the 1890s with the backing of future president William McKinley, both to help industrialists and pay for generous pensions for 2 million civil war veterans and their dependants – a key part of the Republican electorate. It is no accident that President Trump has festooned the White House with pictures of Hamilton, Clay and McKinley – all supporters of protectionism and high tariffs.
In part, the US’s enduring resistance to free trade was because it had access to an internal supply of seemingly limitless raw materials, while its rapidly growing population, fuelled by immigration, provided internal markets that fuelled its growth while keeping out foreign competition.
By the late 19th century, the US was the world’s biggest steel producer with the largest railroad system in the world and was moving rapidly to exploit the new technologies of the second industrial revolution – based on electricity, petrol engines and chemicals. Yet it was only after the second world war that the US assumed the role of global superpower – in part because it was the only country on either side of the war that had not suffered severe damage to its economy and infrastructure.
In the wake of global destruction in Europe and Asia, the US’s dominance was political, military and cultural, as well as financial – but the US vision of a globalised world had some important differences from its British predecessor.
The US took a much more universalist and rules-based approach, focusing on the creation of global organisations that would establish binding regulations – and open up global markets to unfettered American trade and investment. It also aimed to dominate the international economic order by replacing the pound sterling with the US dollar as the global medium of exchange.
Within a week of its entry in the second world war, plans were laid to establish US global financial hegemony. The US treasury secretary, Henry Morgenthau, began work on establishing an “inter-allied stabilisation fund” – a playbook for post-war monetary arrangements which would enshrine the US dollar at its heart.
This led to the creation of the International Monetary Fund (IMF) and World Bank at the Bretton Woods conference in New Hampshire in 1944 – institutions dominated by the US, which encouraged other countries to adopt the same economic model both in terms of free trade and free enterprise. The Allied nations who were simultaneously meeting to establish the United Nations to try to ensure future world peace, having suffered the devastating effects of the Great Depression and war, welcomed the US’s commitment to shape a new, more stable economic order.
How the 1944 Bretton Woods deal ensured the US dollar would be the world’s dominant currrency. Video: Bloomberg TV.
As the world’s biggest and strongest economy, there was (initially) little resistance to this US plan for a new international economic order in its own image. The motive was as much political as economic: the US wanted to provide economic benefits to ensure the loyalty of its key allies and counter the perceived threat of a communist takeover – in complete contrast to Trump’s mercantilist view today that all other countries are out to “rip off” the US, and that its own military might means it has no real need for allies.
After the war finally ended, the US dollar, now linked to gold at a fixed rate of $35 per ounce to guarantee its stability, assumed the role as the free world’s principal currency. It was both used for global trade transactions and held by foreign central banks as their currency reserves – giving the US economy an “exorbitant privilege”. The stable value of the dollar also made it easier for the US government to sell Treasury bonds to foreign investors, enabling it to more easily borrow money and run up trade deficits with other countries.
The conditions were set for an era of US political, financial and cultural dominance, which saw the rise of globally admired brands such as McDonald’s and Coca Cola, as well as a powerful US marketing arm in the form of Hollywood. Perhaps even more significantly, the relaxed, well-funded campuses of California would prove a perfect petri dish for the development of new computer technologies – backed initially by cold war military investment – which, decades later, would lead to the birth of the big-tech companies that dominate the tech landscape today.
The US view of globalisation was broader and more interventionist than the British model of free trade and empire. Rather than having a formal empire, it wanted to open up access to the entire world economy, which would provide global markets for American products and services.
The US believed you needed global economic institutions to police these rules. But as in the British case, the benefits of globalisation were still unevenly shared. While countries that embraced export-led growth such as Japan, Korea and Germany prospered, other resource-rich but capital-poor countries such as Nigeria only fell further behind.
From dream to despair
Though the legend of the American dream grew and grew, by the 1970s the US economy was coming under increasing pressure – in particular from German and Japanese rivals, who by then had recovered from the war and modernised their industries.
Troubled by these perceived threats and a growing trade deficit, in 1971 President Richard Nixon stunned the world by announcing that the US was going off the gold standard – forcing other countries to bear the cost of adjustment for the US balance of payments crisis by making them revalue their currencies. This had a profound effect on the global financial system: within a decade, most major currencies had abandoned fixed exchange rates for a new system of floating rates, effectively ending the 1944 Bretton Woods settlement.
US president Richard Nixon announces the US is leaving the gold standard on August 15 1971.
The end of fixed exchange rates opened the door to the “financialisation” of the global economy, vastly expanding global investment and lending – much of it by US financial firms. This gave succour to the burgeoning neoliberal movement that sought to further rewrite the rules of the financial world order. In the 1980s and ’90s, these policy prescriptions became known as the Washington consensus: a set of rules – including opening markets to foreign investment, deregulation and privatisation – that was imposed on developing economies in crisis, in return for them receiving support from US-led organisations like the World Bank and IMF.
In the US, meanwhile, the increasing reliance on the finance and hi-tech sectors increased levels of inequality and fostered resentment in large parts of American society. Both Republicans and Democrats embraced this new world order, shaping US policy to favour their hi-tech and financial allies. Indeed, it was the Democrats who played a key role in deregulating the financial sector in the 1990s.
Meanwhile, the decline of US manufacturing industries accelerated, as did the gap between the incomes of those in the hinterland, where manufacturing was based, and residents of the large metropolitan cities.
By 2023, the lowest 50% of US citizens received just 13% of total personal income, while the top 10% received almost half (47%). The wealth gap was even greater, with the bottom 50% only having 6% of total wealth, while a third (36%) was held by just the top 1%. Since 1980, real incomes of the bottom 50% have barely grown for four decades.
The bottom half of the US population was suffering from a surge in “deaths of despair” – a term coined by the Nobel-winning economist Angus Deaton to describe high mortality rates from drug abuse, suicide and murder among younger working-class Americans. Rising costs of housing, medical care and university education all contributed to widespread indebtedness and growing financial insecurity. By 2019, a study found that two-thirds of people who filed for bankruptcy cited medical issues as a key reason.
The decline in US manufacturing accelerated after China was admitted to the World Trade Organization in 2001, increasing America’s soaring trade and budget deficit even more. Political and business elites hoped the move would open up the huge Chinese market to US goods and investment, but China’s rapid modernisation made its industry more competitive than its American rivals in many fields.
Ultimately, this era of intensive financialisation of the world economy created a series of regional and then global financial crises, damaging the economies of many Latin American and Asian economies. This culminated in the 2008 global financial crisis, precipitated by reckless lending by US financial institutions. The world economy took more than a decade to recover as countries wrestled with slower growth, lower productivity and less trade than before the crisis.
For those who chose to read it, the writing was on the wall for America’s era of global domination decades ago. But it would take Trump’s victory in the 2016 presidential election – a profound shock to many in the US “liberal establishment” – to make clear that the US was now on a very different course that would shake up the world.
Making a bad situation more dangerous
In my view, Trump is the first modern-day US president to fully understand the powerful alienation felt by many working-class American voters, who believed they were left out of the US’s immense post-war economic growth that so benefited the largely urban American middle classes. His strongest supporters have always been lower-middle-class voters from rural areas who are not college-educated.
Yet Trump’s key policies will ultimately do little for them. High tariffs to protect US jobs, expulsion of millions of illegal immigrants, dismantling protections for minorities by opposing DEI (diversity, equality and inclusion) programmes, and drastically cutting back the size of government will have increasingly negative economic consequences in the future, and are very unlikely to restore the US economy to its previous dominant position.
US president Donald Trump unveils his global tariff ‘hit list’ on April 3 2025. BBC News.
Long before he first became president, Trump hated the eye-watering US trade deficit (he’s a businessman, after all) – and believed that tariffs would be a key weapon for ensuring US economic dominance could be maintained. Another key part of his “America First” ideology was to repudiate the international agreements that were at the heart of the US’s postwar approach to globalisation.
In his first term, however, Trump (having not expected to win) was ill-prepared for power. But second time around, conservative thinktanks had spent years outlining detailed policies and identifying key personnel who could implement the radical U-turn in US economic policy.
Under Trump 2.0, we have seen a return to the mercantilist point of view reminiscent of France in the 17th and 18th centuries. His assertion that countries which ran a trade surplus with the US “were ripping us off” echoed the mercantilist belief that trade was a zero-sum game – rather than the 20th-century view, pioneered by the US, that globalisation brings benefits to all, no matter the precise balance of that trade.
Trump’s tax-and-tariff plans, which extend the tax breaks to the very rich while reducing benefits for the poor through benefit cuts and tariff-driven inflation, will increase inequality in the US.
At the same time, the passing of the One Big Beautiful Bill is predicted to add some US$3.5 trillion to US government debt – even after the Elon Musk-led “Department of Government Efficiency” cuts imposed on many Washington departments. This adds pressure to the key US Treasury bond market at the centre of the world financial system, and raises the cost of financing the huge US deficit while weakening its credit rating. Continuing these policies could threaten a default by the US, which would have devastating consequences for the entire global financial system.
For all the macho grandstanding from Trump and his supporters, his economic policies are a demonstration of American weakness, not strength. While I believe his highlighting of some of the ills of the US economy were overdue, the president is rapidly squandering the economic credibility and good will that the US built up in the postwar years, as well as its cultural and political hegemony. For people living in America and elsewhere, he is making a bad situation more dangerous – including for many of his most ardent supporters.
That said, even without Trump’s economic and societal disruptions, the end of the US era of hegemonic dominance would still have happened. Globalisation is not dead, but it is dying. The troubling question we all face now, is what happens next.
This is the first of a two-part Insights long read on the rise and fall of globalisation. In part two: what comes next?
To hear about new Insights articles, join the hundreds of thousands of people who value The Conversation’s evidence-based news. Subscribe to our newsletter.
Steve Schifferes does not work for, consult, own shares in or receive funding from any company or organisation that would benefit from this article, and has disclosed no relevant affiliations beyond their academic appointment.


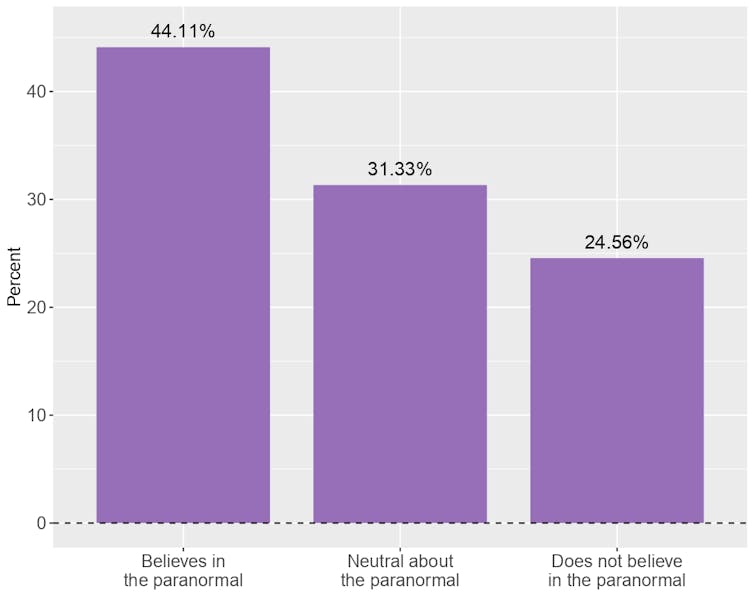
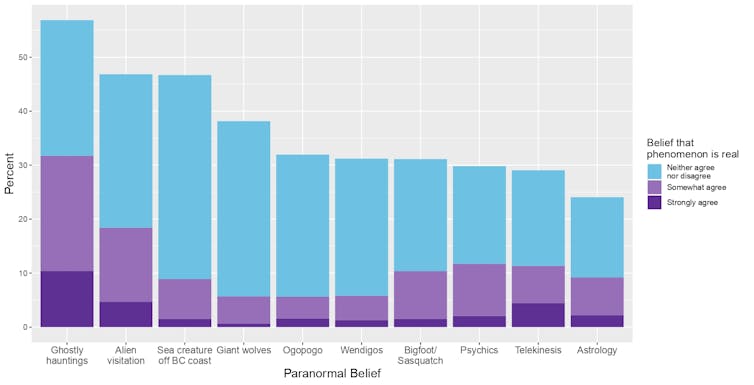


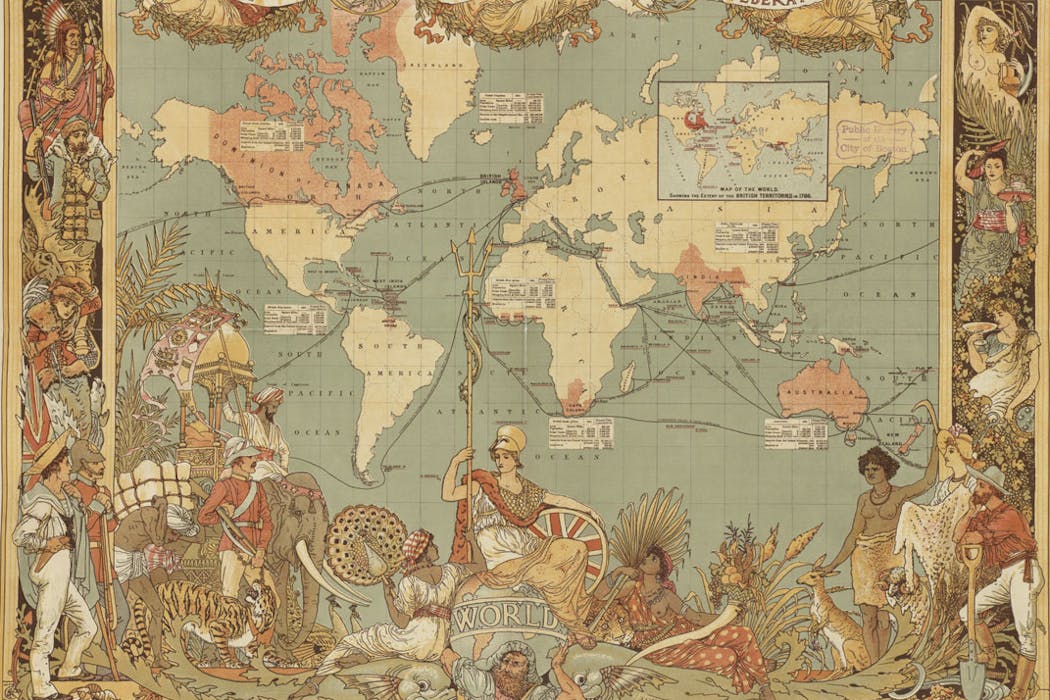


.jpg)