Shutdowns are as American as apple pie − in the UK and elsewhere, they just aren’t baked into the process

Source: The Conversation – USA – By Garret Martin, Hurst Senior Professorial Lecturer, Co-Director Transatlantic Policy Center, American University School of International Service

The obligatory showing of the red briefcase containing budget details is as exciting as it gets in the U.K. Justin Tallis – WPA Pool/Getty Images

When it comes to shutdowns, the U.S. is very much an exception rather than the rule.

On Oct. 1, 2025, hundreds of thousands of federal employees were furloughed as the business of government ground to a halt. With negotiations in Congress seemingly deadlocked over a funding deal, many political watchers are predicting a lengthy period of government closure.

According to the nonpartisan nonprofit Committee for a Responsible Federal Budget, the latest shutdown represents the 20th such funding gap since 1976.

But it doesn’t have to be like this – and in most countries, it isn’t. Other Western democracies experience polarization and political turmoil, too, yet do not experience this problem. Take for example the U.K., traditionally one of Washington’s closest allies and home to the “mother of parliaments.”

In the British system, government shutdowns just don’t happen – in fact, there has never been one and likely never will be.

A sign reads 'The US Capitol Visitors Center is closed due to a lapse in appropriations.'
The U.S. Capitol Visitors Center is closed to visitors during the federal government shutdown on Oct. 01, 2025.
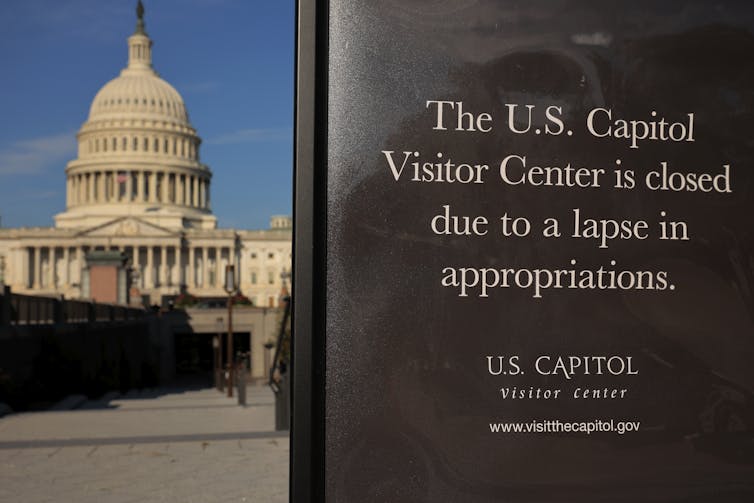
Chip Somodevilla/Getty Images

So why do they occur in Washington but not London? Essentially, it comes down to four factors: the relative power of the legislature; how easy it is to pass a budget; the political stakes at play; and distinctive appropriation rules.

1. Legislative power

There are significant differences in how the legislatures of the U.K. and U.S. shape the budgetary process.

In the U.K., only the executive branch – the party or coalition in power – has the authority to propose spending plans. Parliament, which consists of members from all political parties, maintains an oversight and approval role, but it has very limited power over the budgetary timeline or to amend spending plans. This is a stark contrast with the U.S., where Congress – which may be split or controlled by a party different to the executive – plays a far more consequential role.

The U.S. president starts the budget process by laying out the administration’s funding priorities. Yet, the Constitution grants Congress the power of the purse – that is, the power to tax and spend.

Moreover, past legislation has bolstered congressional control. The 1974 Congressional Budget Act helped curtail presidential involvement in the budgeting process, giving Congress more authority over the timeline. That gave Congress more power but also offered it more opportunities to bicker and derail the budgetary process.

2. Thresholds to pass a budget

Congress and the U.K. Parliament also differ when it comes to their voting rules. Passing the U.S. budget is inherently more complicated, as it requires the support of both the Senate and the House of Representatives.

In Parliament, however, the two houses – the elected House of Commons and unelected House of Lords – are not equally involved. The two Parliament Acts of 1911 and 1949 limited the power of the House of Lords, preventing it from amending or blocking laws relating to budgeting.

Additionally, approving the budget in Westminster requires only an absolute majority of votes in the House of Commons. That tends to be quite a straightforward hurdle to overcome in the U.K. The party in power will typically also command a majority of votes in the chamber or be able to muster one up with the support of smaller parties. It is not, however, so easy in Congress. While a simple majority suffices in the House of Representatives, the Senate still has a 60-vote requirement to close debates before proceeding with a majority vote to pass a bill.

3. Political stakes

U.S. and U.K. politicians do not face the same high stakes over budget approval. Members of Congress may eventually pay a political price for how they vote on the budget, but there is no immediate threat to their jobs. That is not so in the U.K.

Indeed, the party or coalition in power in the U.K. must maintain the “confidence” of the House of Commons to stay in office. In other words, they need to command the support of the majority for key votes. U.K. governments can actually fall – be forced to resign or call for new elections – if they lose formal votes of confidence. Since confidence is also implied in other major votes, such as over the annual budget proposals, this raises the stakes for members of Parliament. They have tended to think twice before voting against a budget, for fear of triggering a dissolution of Parliament and new elections.

4. Distinctive appropriation rules

Finally, rules about appropriation also set the U.S. apart. For many decades, federal agencies could still operate despite funding bills not being passed. That, however, changed with a ruling by then-Attorney General Benjamin Civiletti in 1980. He determined that it would be illegal for governments to spend money without congressional approval.

That decision has had the effect of making shutdowns more severe. But it is not a problem that the U.K. experiences because of its distinct rules on appropriation. So-called “votes on account” allow the U.K. government “to obtain an advance on the money they need for the next financial year.”

This is an updated version of an article that was first published by The Conversation U.S. on Sept. 28, 2023.

The Conversation

Garret Martin receives funding from the European Union for the Transatlantic Policy Center, which he co-directs.

ref. Shutdowns are as American as apple pie − in the UK and elsewhere, they just aren’t baked into the process – https://theconversation.com/shutdowns-are-as-american-as-apple-pie-in-the-uk-and-elsewhere-they-just-arent-baked-into-the-process-266553

Where George Washington would disagree with Pete Hegseth about fitness for command and what makes a warrior

Source: The Conversation – USA – By Maurizio Valsania, Professor of American History, Università di Torino

On Dec. 4, 1783, after six years fighting against the British as head of the Continental Army, George Washington said farewell to his officers and returned to civilian life. Engraving by T. Phillibrown from a painting by Alonzo Chappell

As he paced across a stage at a military base in Quantico, Virginia, on Sept. 30, 2025, Secretary of Defense Pete Hegseth told the hundreds of U.S. generals and admirals he had summoned from around the world that he aimed to reshape the military’s culture.

Ten new directives, he said, would strip away what he called “woke garbage” and restore what he termed a “warrior ethos.”

The phrase “warrior ethos” – a mix of combativeness, toughness and dominance – has become central to Hegseth’s political identity. In his 2024 book “The War on Warriors,” he insisted that the inclusion of women in combat roles had drained that ethos, leaving the U.S. military less lethal.

In his address, Hegseth outlined what he sees as the qualities and virtues the American soldier – and especially senior officers – should embody.

On physical fitness and appearance, he was blunt: “It’s completely unacceptable to see fat generals and admirals in the halls of the Pentagon and leading commands around the country and the world.”

He then turned from body shape to grooming: “No more beardos,” Hegseth declared. “The era of rampant and ridiculous shaving profiles is done.”

As a historian of George Washington, I can say that the commander in chief of the Continental Army, the nation’s first military leader, would have agreed with some of Secretary Hegseth’s directives – but only some.

Washington’s overall vision of a military leader could not be further from Hegseth’s vision of the tough warrior.

A man in front of a US flag, looking like he is shouting and holding out his fists.
U.S. Secretary of Defense Pete Hegseth speaks to senior military leaders at Marine Corps Base Quantico on Sept. 30, 2025.
Andrew Harnik/Getty Images

280 pounds – and trusted

For starters, Washington would have found the concern with “fat generals” irrelevant. Some of the most capable officers in the Continental Army were famously overweight.

His trusted chief of artillery, Gen. Henry Knox, weighed around 280 pounds. The French officer Marquis de Chastellux described Knox as “a man of thirty-five, very fat, but very active, and of a gay and amiable character.”

Others were not far behind. Chastellux also described Gen. William Heath as having “a noble and open countenance.” His bald head and “corpulence,” he added, gave him “a striking resemblance to Lord Granby,” the celebrated British hero of the Seven Years’ War. Granby was admired for his courage, generosity and devotion to his men.

Washington never saw girth as disqualifying. He repeatedly entrusted Knox with the most demanding assignments: designing fortifications, commanding artillery and orchestrating the legendary “noble train of artillery” that brought cannon from Fort Ticonderoga to Boston.

When he became president, after the Revolution, Washington appointed Knox the first secretary of war – a sign of enduring confidence in his judgment and integrity.

Beards: Outward appearance reflects inner discipline

As for beards, Washington would have shared Hegseth’s concern – though for very different reasons.

He disliked facial hair on himself and on others, including his soldiers. To Washington, a beard made a man look unkempt and slovenly, masking the higher emotions that civility required.

Beards were not signs of virility but of disorder. In his words, they made a man “unsoldierlike.” Every soldier, he insisted, must appear in public “as decent as his circumstances will permit.” Each was required to have “his beard shaved – hair combed – face washed – and cloaths put on in the best manner in his power.”

For Washington, this was no trivial matter. Outward appearance reflected inner discipline. He believed that a well-ordered body produced a well-ordered mind.

To him, neatness was the visible expression of self-command, the foundation of every other virtue a soldier and leader should possess.

That is why he equated beards and other forms of unkemptness with “indecency.” His lifelong battle was against indecency in all its forms. “Indecency,” he once wrote, was “utterly inconsistent with that delicacy of character, which an officer ought under every circumstance to preserve.”

More statesman than warrior

By “delicacy,” Washington meant modesty, tact and self-awareness – the poise that set genuine leaders apart from individuals governed by passions.

For him, a soldier’s first victory was always over himself.

“A man attentive to his duty,” he wrote, “feels something within him that tells him the first measure is dictated by that prudence which ought to govern all men who commits a trust to another.”

In other words, Washington became a soldier not because he was hotheaded or drawn to the thrill of combat, but because he saw soldiering as the highest exercise of discipline, patience and composure. His “warrior ethos” was moral before it was martial.

Washington’s ideal military leader was more statesman than warrior. He believed that military power must be exercised under moral constraint, within the bounds of public accountability, and always with an eye to preserving liberty rather than winning personal glory.

In his mind, the army was not a caste apart but an instrument of the republic – an arena in which self-command and civic virtue were tested. Later generations would call him the model of the “republican general”: a commander whose authority rested not on bluster or bravado but on composure, prudence and restraint.

That vision was the opposite of the one Pete Hegseth performed at Quantico.

A man on a white horse and in a uniform saluting a long line of soldiers in front of him.
Washington formally taking command of the Continental Army on July 3, 1775, in Cambridge, Mass.
Currier and Ives image, photo by Heritage Art/Heritage Images via Getty Images

Discipline and steadiness, not fury and bravado

The “warrior ethos” Hegseth celebrates – loud, performative – was precisely what Washington believed a soldier must overcome.

In March 1778, after Marquis de Lafayette abandoned an impossible winter expedition to Canada, Washington praised caution over juvenile bravado.

“Every one will applaud your prudence in renouncing a project in which you would vainly have attempted physical impossibilities,” he wrote from the snows of Valley Forge.

For Washington, valor was never the same as recklessness. Success, he believed, depended on foresight, not fury, and certainly not bravado.

The first commander in chief cared little for waistlines or whiskers, in the end; what concerned him was discipline of the mind. What counted was not the cut of a man’s figure but the steadiness of his judgment.

Washington’s own “warrior ethos” was grounded in decency, temperance and the capacity to act with courage without surrendering to rage. That ideal built an army – and in time, a republic.

The Conversation

Maurizio Valsania does not work for, consult, own shares in or receive funding from any company or organization that would benefit from this article, and has disclosed no relevant affiliations beyond their academic appointment.

ref. Where George Washington would disagree with Pete Hegseth about fitness for command and what makes a warrior – https://theconversation.com/where-george-washington-would-disagree-with-pete-hegseth-about-fitness-for-command-and-what-makes-a-warrior-266530

Moral panics intensify social divisions and can lead to political violence

Source: The Conversation – USA – By Ron Barrett, Professor of Anthropology, Macalester College

The day before Charlie Kirk was assassinated, I was teaching a college class on science, religion and magic. Our class was comparing the Salem witch trials of the 1690s with the McCarthy hearings of the early 1950s, when U.S. democratic processes were eclipsed by the Red Scare of purported communist infiltration.

The aim of the class was to better understand the concept of moral panics, which are societal epidemics of disproportionate fear of real or perceived threats. Such outsized fear can often lead to violence or repression against certain socially marginalized groups. Moral panics are recurring themes in my research on the anthropology of fear and discrimination.

Our next class meeting would apply the moral panic concept to a recent example of political violence. Tragically, there were many of these examples to choose from.

Minnesota State Representative Melissa Hortman and her husband were assassinated on June 14, 2025, which happened to be the eighth anniversary of the congressional baseball shootings in which U.S. House Majority Whip Steve Scalise and three other Republicans were wounded. These shootings were among at least 15 high-profile instances of political violence since Rep. Gabby Gifford was severely wounded in a 2011 shooting that killed five and wounded another 13 people.

Seven of these violent incidents occurred within the past 12 months. Kirk’s killing became the eighth.

In most of these cases, we may never fully know the perpetrator’s motives. But the larger pattern of political violence tracks with the increasing polarization of American society. While researching this polarization, I have found recurring themes of segregation and both the dehumanization and disproportionate fear of people with opposing views among liberals and conservatives alike.

Segregation and self-censorship

The first ingredient of a moral panic is the segregation of a society into at least two groups with limited contact between them and an unwillingness to learn from one another.

In 17th century Salem, Massachusetts, the social divisions were long-standing. They were largely based on land disputes between family factions and economic tensions between agriculturally-based village communities and commercially-based town communities.

Within these larger groups, a growing number of widowed women had become socially marginalized for becoming economically independent after their husbands died in colonial wars between New England and New France. And rumors of continuing violence led residents in towns and villages to avoid Native Americans and new settlers in surrounding frontier areas. Salem was divided in many ways.

A black-and-white copy of a painting depicts a trial in Salem, Massachusetts, in 1692.
The painting ‘Trial of George Jacobs of Salem for Witchcraft’ by Tompkins Harrison Matteson. Jacobs was one of the few men accused of witchcraft.
Tompkins Harrison Matteson/Library of Congress via AP

Fast forward to the end of World War II. That’s when returning American veterans used their benefits to settle into suburban neighborhoods that would soon be separated by race and class through zoning policies and discriminatory lending practices. This set the stage for what has come to be called The Big Sort, the self-segregation of people into neighborhoods where residents shared the same political and religious ideologies.

It was during the early stages of these sorting processes that the Red Scare and McCarthy hearings emerged.

The Big Sort turned digital in the early 2000s with the rise of online information and social media platforms with algorithms that conform to the particular desires and biases of their user communities.

Consequently, it is now easier than ever for conservatives and liberals to live in separate worlds of their own choosing. Under these conditions, Democrats and Republicans tend to exaggerate the characteristics of the other party based on common stereotypes.

Dehumanization and discrimination

Dehumanization is perhaps the most crucial ingredient of a social panic. This involves labeling people according to categories that deprive them of positive human qualities. This labeling process is often conducted by “moral entrepreneurs” – people invested by their societies with the authority to make such claims in an official, unquestionable and seemingly objective way.

In 1690s Massachusetts, the moral entrepreneurs were religious authorities who labeled people as satanic witches and killed many of them. In 1950s Washington, the moral entrepreneurs were members of Congress and expert witnesses who labeled people Soviet collaborators and ruined many of their lives.

In the 21st century, the moral entrepreneurs include media personalities and social influencers as well as the nonhuman bots and algorithms whose authority is derived by constructing the illusion of broad consensus.

Under these conditions, many U.S. liberals and conservatives regard their counterparts as savage, immature, corrupt or malicious. Not surprisingly, surveys reveal that animosity between conservatives and liberals has been at its highest over the past five years than any other time since the measurements first began in 1978.

Adding to the animosity, dehumanization can also justify discrimination against a rival group. This is shown in social psychology experiments in which conservatives and liberals discriminate against one another to a greater degree than by race when deciding on scholarships and job opportunities. Such discrimination lends credence to further animosity.

Exaggerating fear

There is a fine line between animosity and disproportional fear. The latter can lead to extreme policies and violent actions during a moral panic.

Such fear often takes the form of perceived threats. Rachel Kleinfeld, a scholar who studies polarization and political violence, says that one of the best ways to rally a political base is to make them think they are under attack by the other side. She says that “is why ‘They are out to take your x’ is such a time-honored fundraising and get-out-the-vote message.”

In the past few years, the “x” that could be taken has escalated to core freedoms and personal safety, threats which could easily trigger widespread fear on both sides of the political divide.

But the question remains whether exaggerated fears are sufficient to trigger political violence. Are assassins like Kirk’s killer simply pathological outliers among agitated but otherwise self-restrained populations? Or are they sensitive indicators of a looming social catastrophe?

A black-and-white photo shows two men dressed in suits sitting in front of a desk.
The House Committee on Un-American Activities investigates movie producer Jack Warner, right, in Washington on Oct. 20, 1947.
AP Photo

Countering the panic

We do not have the answers to that question yet. But in the interim, there are efforts in higher education to reduce animosity and encourage constructive interactions and discussion between people with different perspectives.

A nonpartisan coalition of faculty, students and staff – known as the Heterodox Academy – is promoting viewpoint diversity and constructive debates on over 1,800 campuses. The college where I teach has participated in the Congress to Campus program, promoting bipartisan dialogue by having former legislators from different parties engage in constructive debates with one another about timely political issues. These debates serve as models for constructive dialogue.

It was in the spirit of constructive dialogue that my class debated whether the Kirk assassination could be explained as the product of a moral panic. Many agreed that it could, and most agreed it was probably an assault on free speech despite having strong objections to Kirk’s views. The debate was passionate, but everyone was respectful and listened to one another. No witches were to be found in the class that day.

The Conversation

Ron Barrett does not work for, consult, own shares in or receive funding from any company or organization that would benefit from this article, and has disclosed no relevant affiliations beyond their academic appointment.

ref. Moral panics intensify social divisions and can lead to political violence – https://theconversation.com/moral-panics-intensify-social-divisions-and-can-lead-to-political-violence-265238

Trump scraps the nation’s most comprehensive food insecurity report − making it harder to know how many Americans struggle to get enough food

Source: The Conversation – USA (2) – By Tracy Roof, Associate Professor of Political Science, University of Richmond

Nearly 1 in 7 Americans had trouble consistently getting enough to eat in 2023. Patrick Strattner/fStop via Getty Images

The Trump administration announced on Sept. 20, 2025, that it plans to stop releasing food insecurity data. The federal government has tracked and analyzed this data for the past three decades, but it plans to stop after publishing statistics pertaining to 2024 data. The Conversation U.S. asked Tracy Roof, a political scientist who has researched the history of government nutrition programs, to explain the significance of the U.S. Household Food Security Survey and what might happen if the government discontinues it.

What’s food insecurity?

The U.S. Department of Agriculture defines food security as “access by all people at all times to enough food for an active, healthy life.”

People who are food insecure are unsure they can get enough food or unable to get enough food to meet these basic needs because they can’t afford it.

How does the government measure it?

The USDA has collected data on food insecurity since the mid-1990s. It includes the share of the population that is food insecure and a subset of this group considered to have very low food security.

People who are food insecure may not significantly reduce how much they eat, but they are likely to eat less balanced meals or lower-quality food. People with very low food security report eating less altogether, such as by skipping meals or eating smaller meals.

These statistics are based on answers to questions the USDA adds to the Current Population Survey, which the Census Bureau administers every December. There are 10 questions in the survey. Households with children are asked four more.

The questions inquire about access to food, such as whether someone has worried in the past year that their food would run out before they had enough money to buy more, or how frequently they have skipped meals, could not afford balanced meals, or felt hunger.

The U.S. food insecurity rate stood at 13.5% in 2023, the most recent year for which data is currently available. The final annual food security report, expected in October, will be issued for 2024 – based on data collected during the Biden administration’s last year.

Why did the government start measuring it?

Calls for creating the food stamp program in the 1960s led to an intense debate in Washington about the extent of malnutrition in the U.S. Until then, the government did not consistently collect reliable or national statistics on the prevalence of malnutrition.

Those concerns reached critical mass when the Citizens’ Board of Inquiry into Hunger and Malnutrition, launched by a group of anti-hunger activists, issued a report in 1968, Hunger USA. It estimated that 10 million Americans were malnourished.

That report highlighted widespread incidence of anemia and protein deficiency in children. That same year, a CBS documentary, “Hunger in America,” shocked Americans with disturbing images of malnourished children. The attention to hunger resulted in a significant expansion of the food stamp program, but it did not lead to better government data collection.

The expansion of government food assistance all but eliminated the problem of malnutrition. In 1977, the Field Foundation sent teams of doctors into poverty stricken areas to assess the nutritional status of residents. Although there were still many people facing economic hardship, the doctors found there was little evidence of the nutritional deficiencies they had seen a decade earlier.

Policymakers struggled to reach a consensus on the definition of hunger. But the debate gradually shifted from how to measure malnutrition to how to estimate how many Americans lacked sufficient access to food.

Calls for what would later be known as food insecurity data grew after the Reagan administration scaled back the food stamps program in the early 1980s. Despite the unemployment rate soaring to nearly 11% in 1982 and a steep increase in the poverty rate, the number of people on food stamps had remained relatively flat.

Although the Reagan administration denied that there was a serious hunger problem, news reports were filled with stories of families struggling to afford food.

Many were families of unemployed breadwinners who had never needed the government’s help before. During this period, the number of food banks grew substantially, and they reported soaring demand for free food.

Because there was still no government data available to resolve the dispute, the Reagan administration responded to political pressure by creating a task force on hunger in 1983. It called for improved measures of the nutritional status of Americans.

The task force also pointed to the difference between “hunger as medically defined” and “hunger as commonly defined.” That is, someone can experience hunger – not getting enough to eat – without displaying the physical signs of malnutrition. In other words, it would make more sense to measure access to food as opposed to the effects of malnutrition.

In 1990 Congress passed the National Nutrition Monitoring and Related Research Act, which President George H.W. Bush signed into law. It required the secretaries of Agriculture and Health and Human Services to develop a 10-year plan to assess the dietary and nutritional status of Americans. This plan, in turn, recommended developing a standardized measurement of food insecurity.

The Food Security Survey, developed in consultation with a team of experts, was first administered in 1995. Rather than focusing on nutritional status, it was designed to pick up on behaviors that suggested people were not getting enough to eat.

Did tracking food insecurity help policymakers?

Tracking food insecurity allowed the USDA, Congress, researchers and anti-hunger groups to know how nutritional assistance programs were performing and what types of households continued to experience need. Researchers also used the data to look at the causes and consequences of food insecurity.

Food banks relied on the data to understand who was most likely to need their help.

The data also allowed policymakers to see the big jump in need during the Great Recession starting in 2008. It also showed a slight decline in food insecurity with the rise in government assistance early in the COVID-19 pandemic, followed by another big jump with steeply rising food prices in 2022.

The big budget bill Congress passed in July will cut spending on the Supplemental Nutrition Assistance Program by an estimated US$186 million through 2034, an almost 20% reduction.

Supporters of SNAP, the new name for the food stamp program adopted in 2008, worry the loss of the annual reports will hide the full impact of these cuts.

Why is the administration doing this?

In the brief press release the USDA issued on Sept. 20 announcing the termination of the annual food insecurity reports, the USDA indicated that the Trump administration considers the food security survey to be “redundant, costly, politicized, and extraneous,” and does “nothing more than fear monger.”

While I disagree with that characterization, it is true that anti-hunger advocates have pointed to increases in food insecurity to call for more government help.

Is comparable data available from other sources?

Although the USDA noted there are “more timely and accurate data sets” available, it was not clear which datasets it was referring to. Democrats have called on the Trump administration to identify the data.

Feeding America, the largest national network of food banks, releases an annual food insecurity report called the Map the Meal Gap. But like other nonprofits and academic researchers that track these trends, it relies on the government’s food insecurity data.

There is other government data on food purchases and nutritional status, and a host of other surveys that use USDA questions. However, there is no other survey that comprehensively measures the number of Americans who struggle to get enough to eat.

As in the 1980s, policymakers and the public may have to turn to food banks’ reports of increased demand to get a sense of whether the need for help is rising or falling. But those reports can’t replace the USDA’s Food Security Survey.

The Conversation

Tracy Roof does not work for, consult, own shares in or receive funding from any company or organization that would benefit from this article, and has disclosed no relevant affiliations beyond their academic appointment.

ref. Trump scraps the nation’s most comprehensive food insecurity report − making it harder to know how many Americans struggle to get enough food – https://theconversation.com/trump-scraps-the-nations-most-comprehensive-food-insecurity-report-making-it-harder-to-know-how-many-americans-struggle-to-get-enough-food-266006

Why Major League Baseball keeps coming back to Japan

Source: The Conversation – USA (2) – By Jared Bahir Browsh, Assistant Teaching Professor of Critical Sports Studies, University of Colorado Boulder

When Shohei Ohtani stepped onto the field at the Tokyo Dome in March 2025, he wasn’t just playing a game – he was carrying forward more than 100 years of baseball ties between the U.S. and Japan.

That history was front and center when the Los Angeles Dodgers and Chicago Cubs opened their 2025 regular season facing off in the Tokyo Series on March 18 and 19. The two games featured several players from Japan, capping a slate of events that included four exhibition games against Japanese professional teams.

It was a massive financial success. Marking MLB’s first return to Tokyo since 2019, the series generated over US$35 million in ticket sales and sponsorship revenue and $40 million in merchandise sales.

The first game of the Tokyo Series broke viewership records in Japan.

For MLB, which has seen significant viewership growth this season, it was proof that its investment in Japan and international baseball over the past three decades has been paying off.

Baseball’s early journey to Japan

Baseball, which is by far the most popular sport in Japan, was introduced to the nation during the Meiji Restoration in the late 19th century.

American baseball promoters were quick to see the potential of the Japanese market, touring the country as early as 1908. The most famous such tour took place in 1934 and featured a number of American League All-Stars, including Babe Ruth and catcher Moe Berg, who was later revealed to be a U.S. spy.

That trip had a long legacy. The U.S. All-Stars faced a team called The Greater Japan Tokyo Baseball Club, which, a year later, barnstormed in the United States. When they played the San Francisco Seals, the Seals’ manager, Lefty O’Doul – who later trained baseball players in Japan – suggested a name change to better promote the team for an American audience.

Commenting that Tokyo is the New York of Japan, O’Doul suggested they take on one of their team names. And since “Yankee” is a uniquely American term, The Greater Japan Tokyo Baseball Club was reborn as the Tokyo (Yomiuri) Giants.

When the Giants returned to Japan, the Japanese Baseball League was formed, which was reorganized into Nippon Professional Baseball in 1950. The Giants have gone on to dominate the NPB, winning 22 Japan Series and producing Sadaharu Oh, who hit 868 home runs during his illustrious career.

Breaking into MLB

The first Japanese-born MLB player, Masanori Murakami, debuted for the San Francisco Giants in September 1964. But his arrival wound up sparking a contractual tug-of-war between the NPB and MLB. To prevent future disputes, the two leagues signed an agreement in 1967 that essentially blocked MLB teams from signing Japanese players.

By the 1990s, this agreement became untenable, as some Japanese players in NPB became frustrated by their lack of negotiating power. After the Kintetsu Buffaloes refused to give Hideo Nomo a multiyear contract after the 1994 season, his agent found a loophole in the “voluntary retirement clause” that would allow him to sign with an MLB franchise. He signed with the Los Angeles Dodgers in February 1995.

Nomo’s impact was immeasurable. His “tornado” windup and early success made him one of the most popular players in the major leagues, which was recovering from the cancellation of the World Series the previous year. In Japan, “Nomo fever” took hold, with large crowds gathering television screens in public to watch him play, even though his games aired in the morning. Nomo helped drive Japanese sponsorship and television rights as his first season ended with him winning National League Rookie of the Year.

But within a few years, disputes over contracts soon showed the need for new rules. This ultimately led to the establishment of posting rules for NPB players looking to transition to the major leagues.

The rules have shifted some since they were set out in late 1998, but if a player declares their intention to leave NPB, then MLB teams have a 45-day window to negotiate. If the player from NPB is under 25 or has less than nine years of professional experience, they’re subject to the limited MLB signing pool for international players. Otherwise, they’re declared a free agent.

A wave of stars

The new rules led many more Japanese players to join major league baseball from Nippon Professional Baseball: Of the 81 Japanese players who’ve played in the majors, all but four played in NPB before their debut. Ichiro Suzuki, who became the first Japanese player inducted into the National Baseball Hall of Fame, was also the first Japanese position player to make the leap.

Other players, like Hideki Matsui, the only Japanese player to be named World Series MVP, continued the success. And then came Ohtani, a two-way superstar who both hits and pitches, drawing comparisons to Babe Ruth.

For MLB, Japanese players haven’t just boosted performance on the field – they’ve expanded its global fan base. The Dodgers brought in over $120 million in increased revenue in Ohtani’s first year alone, easily covering his salary even with Ohtani signing the richest contract in baseball history. The franchise has also seen its value increase by at least 23% to nearly $8 billion. MLB has also seen a significant increase in viewership over the past two seasons, partially driven by the growing interest from Japan.

As American sports leagues deal with an increasingly distracted, fragmented domestic audience, it’s not surprising that they’re looking abroad for growth. And as MLB teams prepare to court another wave of Japanese stars this offseason, it’s clear that its decades-long investment in Japan is paying off.

The Conversation

Jared Bahir Browsh does not work for, consult, own shares in or receive funding from any company or organization that would benefit from this article, and has disclosed no relevant affiliations beyond their academic appointment.

ref. Why Major League Baseball keeps coming back to Japan – https://theconversation.com/why-major-league-baseball-keeps-coming-back-to-japan-264668

Breastfeeding is ideal for child and parent health but challenging for most families – a pediatrician explains how to find support

Source: The Conversation – USA (3) – By Ann Kellams, Professor of Pediatrics, University of Virginia

Many new parents start out breastfeeding but switch to formula within a few days. JGI/Jamie Grill via Tetra Images

As a pediatrician, I thought my medical background and pediatric training meant I would be well prepared to breastfeed my newborn. I knew all about the research on how an infant’s diet can affect both their short- and long-term health. Compared to formula, breastfeeding is linked to a lower risk of sudden infant death syndrome, lower rates of infections and hospitalizations and a lower risk of developing diabetes later in life. Breastfeeding can also provide health benefits to the parent.

But I struggled to breastfeed my own firstborn. I was exhausted and in pain. My nipples were bleeding and my breasts swollen. I worried about whether my baby was getting enough to eat. And I was leaking breast milk all over the place. I found myself asking questions familiar to many new parents: What in the world is going on with breastfeeding? Can I keep this up when I go back to work? How does a breast pump even work? Why doesn’t anyone know how to help me? And why are some families able to start breastfeeding and never look back?

The American Academy of Pediatrics recommends caregivers breastfeed their child for up to two years. However, many new parents are unable to reach these breastfeeding goals and find it very difficult to get breastfeeding going. Combined with inadequate support, some blame themselves or feel like less than a good parent.

While over 80% of families start out breastfeeding their baby, roughly 19% of newborns have already received infant formula two days after birth. Around half of families are able to breastfeed their babies six months after birth and only 36% at 12 months.

Mother breastfeeding newborn, eyes closed in pain, lying in hospital bed at night
Breastfeeding can be painful – especially without support.
Yoss Sabalet/Moment via Getty Images

Inspired by my own and my patients’ experiences with breastfeeding, I sought extra training in the field of breastfeeding and lactation medicine. Now, as a board-certified physician in breastfeeding and lactation medicine, I wanted to understand how pregnant and breastfeeding parents – and those who care for them – perceive breastfeeding. How do they define breastfeeding success? What would make breastfeeding easier, especially for underserved communities with some of the lowest breastfeeding rates in the U.S.

Listening to new parents

In partnership with the Academy of Breastfeeding Medicine and Reaching Our Sisters Everywhere, a nonprofit focused on supporting breastfeeding among Black families, my team and I started a research project to identify the key components of a successful breastfeeding journey as defined by parents. We also wanted to determine what would enable families to achieve their breastfeeding goals.

To do this, we asked a range of parents and experts in the field of breastfeeding and lactation medicine about what would make breastfeeding easier for families. We recruited participants through social media, listservs and at the Academy of Breastfeeding Medicine’s annual international meeting, inviting them to provide feedback through virtual listening sessions, online surveys and in-person gatherings.

What we found is fascinating. From the perspective of the parents we talked to, success for breastfeeding had less to do with how long or to what extent they exclusively breastfed. Rather, success had a lot more to do with their experience with breastfeeding and whether they had the support they needed to make it possible.

Support included someone who could listen and help them with breastfeeding; communities that welcomed breastfeeding in public; and supportive loved ones, friends and workplaces. Having their questions about breastfeeding answered in accessible and practical ways through resources such as breastfeeding and lactation professionals in their area, peer support and websites with reliable, trustworthy information was also important to helping them feel successful in breastfeeding.

Parent sitting in chair with baby in lap, hand on temple, breast pumps in foreground
Figuring out how to make time and room for breastfeeding can be taxing.
FatCamera/iStock via Getty Images Plus

Important questions about breastfeeding also arose from these conversations. How can hospitals, clinics and health care workers make sure that breastfeeding support is available to everyone and is equitable? What education do health care professionals need about breastfeeding, and what are barriers to them getting that education? How should those in health care prepare families to breastfeed before the baby is born? And how can the care team ensure that families know when and how to get help for breastfeeding problems?

The good news is that most of the problems raised within our study are solvable. But it will take an investment in resources and support for breastfeeding, including training health care workers on troubleshooting common problems such as nipple pain, ineffective latch and concerns about breast milk production.

Corporate influences on feeding babies

Commercial infant formula is a US$55 billion dollar industry. And yet, most formula use would not be necessary were barriers to breastfeeding reduced.

Research shows that the marketing practices of commercial infant formula companies are predatory, pervasive and misleading. They target not only families but also health care workers. During my medical training, commercial infant formula companies would give us lectures, free lunches, and books and calculators, and my fellow residents and I knew the representatives by name. As a medical director of a newborn unit, I saw these companies stocking our hospital shelves with commercial infant formula and building relationships with our nursing staff. These companies profit when breastfeeding goes wrong.

The World Health Organization has advocated against aggressive commercial infant formula marketing.

This is not to say that commercial infant formula is a bad thing. When breastfeeding isn’t possible, it can be lifesaving. But in some cases, because the U.S. doesn’t provide universal paid maternity leave and not all workplaces are supportive of breastfeeding, parents may find themselves relying on commercial infant formula.

Thinking about breast milk and commercial infant formula less as a question of lifestyle or brand choices and more as an important health care decision can help families make more informed choices. And health care providers can consider thinking about infant formula as a medicine for when it is necessary to ensure adequate nutrition, putting more focus on helping families learn about and successfully breastfeed.

Breastfeeding is a team sport

As the saying goes, it takes a village to raise a child, and breastfeeding is no exception – it is a team sport that calls upon everyone to help new parents achieve this personal and public health goal.

What can you do differently to support breastfeeding in your family, neighborhood, workplace and community?

When I am educating new or expectant families about breastfeeding, I emphasize skin-to-skin contact whenever the parent is awake and able to monitor and respond to baby. I recommend offering the breast with every feeding cue, until the baby seems content and satisfied after each feeding.

Manually expressing drops of milk into the baby’s mouth after each feeding can boost their intake and also ensure the parent’s body is getting signaled to make more milk.

If your family has concerns about whether the baby is getting enough milk, before reaching for formula, ask a lactation consultant or medical professional who specializes in breastfeeding how to tell whether everything is going as expected. Introducing formula can lead to decreased milk production, the baby preferring artificial nipples over the breast and stopping breastfeeding earlier than planned.

Some parents are truly unable to continue breastfeeding for various reasons, and they should not feel ashamed or stigmatized by it.

Finally, give yourself time for breastfeeding to feel routine – both you and baby are learning.

The Conversation

Ann L. Kellams receives funding from NICHD for her research and Pediatric UptoDate as an author. She is the immediate past-president of the Academy of Breastfeeding Medicine.

ref. Breastfeeding is ideal for child and parent health but challenging for most families – a pediatrician explains how to find support – https://theconversation.com/breastfeeding-is-ideal-for-child-and-parent-health-but-challenging-for-most-families-a-pediatrician-explains-how-to-find-support-240396

Des pesticides dans les nuages : les dessous d’une étude inédite

Source: The Conversation – France (in French) – By Angelica Bianco, Chercheuse en Chimie de l’atmosphère, Université Clermont Auvergne (UCA)

Le puy de Dôme (1 465 mètres), où des scientifiques tâchent de mettre des nuages en bouteille pour analyser leur composition. Wirestock Creators/Shutterstock

Une équipe franco-italienne a pu analyser six échantillons d’eau de nuage prélevés au sommet du massif auvergnat du puy de Dôme à différentes saisons, entre 2023 et 2024. Les chercheurs y ont décelé 32 pesticides différents, dont plusieurs interdits en Europe depuis plus d’une décennie. Un tiers des échantillons présentaient également une concentration totale de pesticides supérieure aux taux réglementaires pour l’eau potable.

Leur travail pionnier a aussi permis d’estimer, pour la première fois, la quantité de pesticides qui se trouveraient dans l’ensemble des nuages bas et moyens de France hexagonale, soit de 6 à 139 tonnes. Retour sur cette publication inédite, avec sa première autrice.


The Conversation : Quelle est la genèse de votre recherche ?

Angelica Bianco : Avec ma collègue chimiste Pascale Besse-Hoggan, experte de l’ICCF (UCA/CNRS) en (bio)dégradation des pesticides dans les sols, nous voulions, depuis quelques années, quantifier les pesticides dans les nuages, car les pesticides sont des contaminants d’intérêt dans toutes les matrices environnementales.

Une étude récente du chercheur Ludovic Mayer et de ses collègues avait déjà rapporté la présence de pesticides dans les aérosols atmosphériques prélevés sur 29 sites en Europe, dont plusieurs en troposphère libre, soit la première couche de l’atmosphère de la Terre qui débute de un à deux kilomètres d’altitude et qui n’est que peu ou pas affectée par les émissions locales.

De plus, la présence de pesticides dans les précipitations est connue depuis longtemps, avec des travaux notables à la fin des années 1990. Nous avons donc profité de l’Observatoire du puy de Dôme, géré par l’Observatoire de physique du globe (OPGC) de Clermont-Ferrand et par le Laboratoire de météorologie physique (LaMP) de l’Université de Clermont-Ferrand (UCA) et du CNRS, pour quantifier les pesticides dans une matrice encore inexplorée jusqu’à présent : les nuages.

Techniquement, ce n’est pas la première mesure dans les nuages. En 1991, l’équipe du chercheur allemand Franz Trautner avait déjà mesuré l’atrazine, un herbicide aujourd’hui interdit qui bloque la photosynthèse de végétaux et qui était fréquemment utilisé dans les champs de maïs, dans plusieurs échantillons collectés dans un même nuage au-dessus de cultures de maïs dans les Vosges avec des concentrations allant de 24 à 260 nanogrammes par litre (ng/l), soit bien plus que la limite autorisée pour l’eau potable.

L’originalité de notre dernière étude repose sur la quantification des pesticides :

  • dans plusieurs échantillons d’eau de nuage, collectés à deux saisons différentes ;

  • avec des masses d’air d’origines différentes (différentes saisons, différentes températures et différentes origines géographiques) …

  • avec une analyse de 446 pesticides (herbicides, fongicides, insecticides, biocides) et quelques produits de dégradation ;

  • avec des limites de détection très faibles en utilisant des méthodologies certifiées (Cofrac).

Nous savions déjà qu’un nombre important de pesticides étaient présents dans les cours d’eau. Il peut donc sembler logique d’en trouver également dans les nuages, cependant, de telles recherches n’ont pas tellement été menées auparavant. Comment expliquez-vous cela ?

A. B. : Les nuages représentent la matrice environnementale la plus difficile à attraper et à échantillonner : ce n’est pas de l’eau d’un lac ou d’une rivière que l’on peut prélever aisément avec un seau et en grande quantité. Ce ne sont pas non plus des poussières ou des gaz, qui sont toujours présents dans l’atmosphère et que l’on peut récolter de façon automatique sur des filtres ou dans des ballons.

Les nuages présentent un caractère évènementiel : ils ne sont pas toujours là ! Bien sûr, il est possible de les échantillonner en avion, comme le font certains de mes collègues. Mais cette méthode est techniquement complexe parce qu’il faut absolument éviter toute contamination de l’échantillon par les moteurs de l’appareil. De plus, les nuages sont constitués de fines gouttelettes (entre 10 et 50 micromètres de diamètre), qu’il faut collecter pour avoir un échantillon liquide suffisant pour faire toutes les analyses. Actuellement, en France, seule la station du puy de Dôme, qui présente une forte occurrence nuageuse (40 % du temps) permet l’étude des nuages.

Notre dispositif n’est pas automatisé, ce qui veut dire qu’un opérateur doit être sur place pour le montage du collecteur, la collecte, le démontage et le traitement de l’échantillon. Nous utilisons un collecteur de nuage baptisé « boogie » et des protocoles très stricts de nettoyage et de collecte de l’échantillon.

3 Boogies permettant d’analyser la composition des nuages
Trois boogies permettant d’analyser la composition des nuages.
Angelica Bianco, Fourni par l’auteur

La quantité d’eau dans les nuages varie de 0,3 à 1 g/m3 d’air, ce qui signifie qu’il faut aspirer beaucoup de nuages pour avoir peu de millilitres. C’est un des points limitants de notre analyse : le volume de nuage collecté.

Nos collectes durent rarement plus de deux heures, parce que nous devons tenir compte de la dynamique atmosphérique. Il est bien plus facile d’étudier les caractéristiques d’un échantillon quand l’histoire de la masse d’air est simple, plutôt que quand il résulte de la combinaison de plusieurs masses d’air différentes. Or, plus le temps passe, plus la composition d’un nuage se complexifie, car les composés emportés dans les différentes masses d’air, influencés par des sources différentes (par exemple, marine et anthropique) se mélangent dans le même échantillon liquide. Pour éviter cela, nous limitons donc la durée de collecte à deux heures, par conséquent nos échantillons sont de faibles volumes et la quantité d’analyses que nous pouvons mener est limitée.

Mais, si je résume, le caractère novateur de notre étude, c’est que nous, chasseurs de nuages, avons la chance de travailler sur une matrice environnementale très peu explorée où tout reste à découvrir.

La doctorante Pauline Nibert explique comment il est possible de mettre « des nuages en bouteille » pour analyser leur composition.

Vous avez été, j’ai cru comprendre, les premiers surpris par les résultats constatés.

A. B. : Franchement, pour le bien de notre belle planète verte et bleue, nous espérions ne pas trouver de pesticides dans les nuages !

La première surprise a donc été la détection de ces composés dans tous les échantillons analysés, même les non suspectés, ceux qui ont une masse d’air qui a voyagé en altitude et sur l’océan Atlantique, donc a priori à une distance éloignée des terres où l’on épand des pesticides.

Nous avons donc fait plusieurs vérifications, notamment un croisement avec les mesures d’aérosols présentées par Ludovic  Mayer de l’Université Masaryk (Tchéquie) et ses collègues, et nos concentrations se sont révélées plausibles. Les concentrations observées restent cependant faibles, de l’ordre du nano au microgramme par litre.

Après discussions, nous avons décidé de calculer la masse totale de pesticides potentiellement présents dans les nuages qui survolent la France hexagonale. Pour cela, nous avons pris le parti de formuler une hypothèse importante, à savoir que la concentration mesurée dans les nuages puydomois est représentative des nuages de basse altitude présents sur l’ensemble du territoire français. C’est discutable, certes, mais probablement pas si loin de la vérité : les relecteurs de notre publication n’ont d’ailleurs jamais remis en question cette hypothèse. Nous avons ainsi évalué qu’il pourrait y avoir entre 6,4 et 139 tonnes de pesticides présents dans les nuages au-dessus de la France.

Alors, il faut savoir que les nuages contiennent beaucoup d’eau, de l’ordre du milliard de tonnes, mais, personnellement et naïvement, je ne pensais pas trouver des tonnes de pesticides ! C’est cette estimation qui a déclenché le plus de réactions et qui a fait le plus parler, en bien comme en plus critique, mais j’estime que l’essentiel, au-delà des chiffres, est la prise de conscience collective de la pollution que nous apportons dans l’environnement.

En quoi vos travaux sont-ils utiles à notre compréhension de la circulation des pesticides dans l’environnement ?

A. B. : De mon point de vue, cet article montre que la boucle est bouclée : les pesticides sont retrouvés dans l’eau des rivières, des lacs, dans les nappes phréatiques, dans la pluie et… maintenant dans les nuages. L’atmosphère est extrêmement dynamique et transporte ces composés, même s’ils sont faiblement concentrés, dans les endroits les plus reculés de notre Terre et finalement, certains lieux isolés, comme les régions polaires, qui ne devraient pas être impactés directement par la pollution par des pesticides, sont finalement exposés par ces transports longue distance.

Mais l’atmosphère et les nuages en particulier sont aussi un réacteur chimique capable de transformer ces molécules : les rayons du soleil provoquent des réactions photochimiques qui peuvent dégrader ces composés. C’est pourquoi nous retrouvons parfois dans nos échantillons des produits de transformation et non le pesticide d’origine. Il est donc aussi important de comprendre comment ces molécules se dégradent dans l’environnement.

Dans quels sens allez-vous poursuivre vos recherches à la suite de cette publication ?

A. B. : Plusieurs collègues ont témoigné d’un vif intérêt pour les résultats présentés dans cet article. En tant que chimiste, je me dis que six échantillons collectés sur un seul site ne suffisent pas à représenter la variabilité environnementale. Je pense donc que cette étude doit être étendue à un plus grand nombre d’échantillons, et si possible, prélevés sur plusieurs sites ! Malgré tout, je garde espoir de trouver de nombreux échantillons sans pesticides dans les prochains nuages que nous collecterons…


Entretien relu par Pascale Besse-Hoggan, co-autrice de l’étude, et réalisé par Gabrielle Maréchaux, journaliste Environnement, The Conversation France.

The Conversation

Angelica Bianco a reçu des financements de l’Agence Nationale de la Recherche (ANR 23-CE01-0015), de la Fédération des Recherches en Environnement (projet PONCOS), de la China Scholarship Council (CSC).

ref. Des pesticides dans les nuages : les dessous d’une étude inédite – https://theconversation.com/des-pesticides-dans-les-nuages-les-dessous-dune-etude-inedite-266505

Le management par objectifs n’est pas une invention nazie

Source: The Conversation – France (in French) – By Aurélien Rouquet, Professeur de logistique, Neoma Business School

Alfred P. Sloan, dirigeant de General Motors dans les années 1920, a « inventé » le management par objectifs. Double Day (couverture du livre publié en 1963)

Les origines du management par objectifs sont-elles à chercher du côté des héritiers du IIIe Reich, comme le prétend l’ouvrage récent de l’historien Johann Chapoutot. Rien n’est moins sûr pour les théoriciens du management : le management par objectifs est né dans l’industrie automobile nord-américaine dès les années 1920.


De quoi le management par objectifs est-il le nom ? Pour l’historien Johann Chapoutot, auteur de Libres d’obéir. Le management, du nazisme à aujourd’hui, l’affaire serait entendue : ce mode de management moderne trouverait sa source voire son inspiration dans l’idéologie du IIIe Reich en Allemagne. Le nazisme aurait inventé un type de management « par délégation », qui se serait ensuite diffusé dans les entreprises contemporaines, sous l’influence notamment du juriste et historien allemand Reinhard Höhn. D’après l’auteur, cet ancien nazi et officier SS a formé, après la Seconde Guerre mondiale, des milliers de cadres au sein de l’Académie de Bad Harzburg (Basse-Saxe).

Que certaines formes de management actuelles soient critiquables, nul ne le contestera. Cela explique vraisemblablement le succès de cet ouvrage d’historien écoulé à 20 000 exemplaires et désormais adapté en bande dessinée. Mais qu’en est-il vraiment de ce lien affirmé, qui a été critiqué par de nombreux connaisseurs de l’histoire des sciences de gestion et du management, tels Thibault Le Texier, Marcel Guenoun, Yves Cohen ou Franck Aggeri.

Implication active des salariés

Pour commencer, revenons sur ce qu’on appelle « management (ou, direction) par objectifs ». Le management par objectifs (MPO) repose sur l’idée que la performance d’une organisation s’améliore lorsque les objectifs sont clairement définis et partagés par la hiérarchie et les collaborateurs. Concrètement, il s’agit d’établir des buts précis, mesurables et limités dans le temps, alignés à la fois sur la stratégie globale de l’entreprise et sur les responsabilités individuelles. Ce processus suppose une implication active des salariés dans la définition de leurs objectifs, afin de favoriser l’adhésion, la motivation et le sens donné à leur travail.

Au-delà de l’établissement d’objectifs, le MPO intègre un suivi régulier des résultats et un dialogue continu entre managers et collaborateurs. Ce système encourage l’autonomie dans la mise en œuvre, tout en instaurant des mécanismes d’évaluation périodiques, qui permettent d’ajuster les actions, de reconnaître les réussites et d’identifier les axes de progrès.

L’enjeu est donc double : améliorer la performance collective de l’organisation et développer les compétences individuelles, dans une logique de responsabilisation et de coopération.


À lire aussi :
À 70 ans, le management par objectifs reste indépassable


Une invention nazie ?

Dans son livre, Johann Chapoutot défend la thèse que ce type de management aurait été en quelque sorte « inventé » par les nazis. Pour cela, dans la première partie, l’historien s’attache à décrire le fonctionnement du nazisme. Spécialiste reconnu de cette période, il se montre particulièrement convaincant lorsqu’il analyse la pensée antiétatique développée par les juristes SS : rejet de l’État « judéo-romain », mise en place d’une polycratie fondée sur la concurrence entre institutions, et recours à l’arbitrage ultime du führer (dirigeant) dans une logique darwinienne. Ces analyses, denses et précises, se révèlent particulièrement stimulantes.

Mais J. Chapoutot franchit ensuite dans la suite du livre un pas risqué : il affirme que de cette conception serait née une vision du management par délégation, fondée sur la fameuse « liberté d’obéir » pour reprendre l’expression forgée par lui. Que recouvre cette idée ? Pour l’universitaire, le nazi n’est pas contraint : il est « libre » dans le choix des moyens pour atteindre des objectifs fixés d’en haut, mais il n’a aucun droit de discuter la finalité. On obéit, mais avec une marge d’initiative. Cette liberté encadrée serait, selon J. Chapoutot, l’ancêtre de notre management par objectifs.

Déjà chez General Motors

Le problème est que, comme le rappelle Yves Cohen, ce modèle n’a rien de nazi. La délégation par objectifs existait déjà depuis plusieurs années. Alfred P. Sloan l’avait mise en place chez General Motors (GM) aux États-Unis dans les années 1920, à un moment où GM devait gérer la complexité d’un conglomérat en pleine expansion. Contrairement à Ford, qui reposait alors sur une structure très centralisée, orientée autour d’un modèle unique (la Ford T) et d’un contrôle direct exercé depuis le sommet, GM fit le choix d’une organisation décentralisée. Chaque division bénéficiait d’une autonomie significative dans ses décisions, mais devait rendre compte de ses performances à travers des objectifs chiffrés, principalement financiers. Ce dispositif permettait de combiner la souplesse et l’adaptation locales avec un contrôle global exercé par le siège.

Dans les années 1940, Peter Drucker étudie les pratiques de GM. Après avoir mis en évidence la structure décentralisée de l’entreprise dans Concept of the Corporation (1946), il théorise le management par objectifs en 1954 dans un autre ouvrage qui aura une forte influence : The Practice of Management. Cet ouvrage qui deviendra un best-seller mondial, a été publié bien avant que l’Académie de Bad Harzburg ne voie le jour et que Reinhard Höhn publie ses ouvrages – ouvrages, dont la renommée ne dépassera jamais l’Allemagne puisque, comme le rappelle Thibault Le Texier, ils ne seront jamais traduits en français ou en anglais. Ainsi, ce que Chapoutot présente comme une invention nazie est en réalité une idée qui était déjà théorisée depuis quelques années à partir des pratiques américaines, et largement popularisée par Peter Drucker. Bref, le management par objectifs vient de Detroit, pas de Berlin.

Il est d’autant plus surprenant que Chapoutot se laisse aller à une telle thèse que depuis des décennies, et à la suite de l’historien Alfred Chandler et de son ouvrage sur la Main visible des managers (1977), de multiples travaux historiques ont été menés sur l’essor des entreprises et du management. Les faits présentés ici sont par conséquent très largement connus par une large communauté de chercheurs qui publient dans d’excellents journaux. Citons en France la revue Entreprise & Histoire, et, à l’international, Business History.

Bad Harzburg n’est pas Harvard

Deuxième pilier de la thèse de Johann Chapoutot : Reinhard Höhn, ancien SS devenu directeur de l’Académie de Bad Harzburg, aurait diffusé la « liberté d’obéir » auprès de centaines de milliers de cadres, influençant ainsi le management contemporain. Là encore, la démonstration ne convainc pas. Certes, 600 000 cadres allemands sont passés par Bad Harzburg en cinquante ans. Mais cette institution n’a jamais eu le poids intellectuel de l’École des hautes études commerciales (HEC) de Paris, ni celui de Harvard, ni celui des plus prestigieuses institutions allemandes que sont, par exemple, Mannheim Business School, ou WHU–Otto-Beisheim School of Management. Pas de recherche internationale ni de publications scientifiques reconnues qui en sont issues, encore moins de rayonnement mondial.

Bad Harzburg n’est ainsi aucunement un centre influent de la pensée managériale et, contrairement à la pensée de Peter Drucker dont l’ouvrage est, à la date, où j’écris ces lignes, cité selon Google scholar par 21 608 autres textes, les ouvrages de Höhn ne sont aucunement cités par les grands théoriciens du management. Comme l’a souligné Thibault Le Texier, J. Chapoutot ne montre pas, par ailleurs, combien d’entreprises ont appliqué ses méthodes ni si elles ont eu le moindre impact hors d’Allemagne. Bref, Höhn n’est clairement pas Drucker : c’est un ancien nazi recyclé, dont l’influence est restée locale, limitée à un cercle étroit d’entreprises de la République fédérale d’Allemagne d’alors.

France Culture, 2021.

Assimiler le management au nazisme est une reductio ad Hitlerum, en aucun cas une thèse démontrée. Certes, le management moderne mérite d’être critiqué : culte de la performance, absurdité des indicateurs, prolifération des « bullshit jobs ». Mais pour comprendre ces dérives, nul besoin de convoquer Hitler, mieux vaut lire les spécialistes du champ des critical management studies. Le management que nous connaissons n’est pas le produit du nazisme. Cette manière de diriger et d’organiser le travail est bien plus le produit du capitalisme industriel, de l’Amérique des années 1920 et des business schools d’après-guerre.

The Conversation

Aurélien Rouquet ne travaille pas, ne conseille pas, ne possède pas de parts, ne reçoit pas de fonds d’une organisation qui pourrait tirer profit de cet article, et n’a déclaré aucune autre affiliation que son organisme de recherche.

ref. Le management par objectifs n’est pas une invention nazie – https://theconversation.com/le-management-par-objectifs-nest-pas-une-invention-nazie-265633

Pour des forêts à croissance rapide, favorisez les arbres à croissance lente

Source: The Conversation – in French – By Marie Charru, Maîtresse de conférence en sylviculture et aménagement forestier, Bordeaux Sciences Agro

Les forêts participent grandement à l’atténuation du changement climatique par leur capacité à capturer le CO2. Dès lors, quelles espèces d’arbres favoriser pour reconstituer des forêts rapidement ? Le bon sens nous soufflerait de privilégier les arbres à croissance rapide… mais la réalité des dynamiques forestières est plus complexe.


Pour gagner une course de vitesse, choisiriez-vous une Formule 1 ou une voiture de rallye ? D’emblée, on aurait plutôt le réflexe de tout miser sur la Formule 1. Puis on se demanderait, peut-être, quelle est la nature du circuit : on a du mal à imaginer une Formule 1 être performante sur une piste cabossée, et on préférera dans ce cas une voiture plus robuste.

Il en va de même pour la croissance des arbres : si certaines espèces, prises de façon isolée, sont théoriquement bien équipées pour maximiser leur vitesse de croissance, elles sont en fait rarement gagnantes dans les forêts, où les conditions sont plus contraignantes. Comme la vitesse de croissance va de pair avec la capacité des arbres à séquestrer du dioxyde de carbone (le CO2), cela a des implications importantes concernant les capacités des forêts à atténuer le changement climatique.

Il s’agit pourtant d’un des nombreux services écosystémiques que celles-ci fournissent. Outre la régulation microclimatique, la préservation de la biodiversité, la purification de l’air et de l’eau et la protection des sols, les forêts constituent, avec les océans, l’un des deux puits de carbone les plus importants, de par leur capacité à stocker du carbone dans les sols et dans la biomasse des arbres. Les gestionnaires forestiers se posent alors une question clé : quelles espèces d’arbres ont le plus grand potentiel d’atténuation ?

Un premier élément de réponse consiste à identifier les espèces d’arbres qui grandissent le plus rapidement : plus un arbre pousse vite, plus il séquestre de carbone à travers la photosynthèse. Promouvoir des arbres à croissance rapide semble un des leviers de l’atténuation du changement climatique.

Mais est-ce vraiment le cas ? Pour tester cette hypothèse, nous avons mené récemment une étude. Dans ce travail mené par Bordeaux Sciences Agro et l’Inrae, réunissant un consortium international de chercheurs, nous avons analysé la croissance de 233 espèces d’arbres dans 160 forêts expérimentales réparties dans le monde entier.

Deux grandes familles d’arbres

Nous avons étudié la relation entre la vitesse de croissance des espèces et certaines de leurs caractéristiques appelées « traits fonctionnels ».

Un érable en automne.
Sid Dahal/Pexels

Ceux-ci permettent de séparer les espèces en deux grandes catégories :

  • Les espèces dites « acquisitives », comme les érables ou les peupliers. Elles sont caractérisées par leur efficacité dans l’acquisition de ressources (lumière, eau, nutriments) et dans la transformation de ces ressources en biomasse (richesse des feuilles en enzymes et en nutriments pour faire la photosynthèse). Cela passe par l’optimisation des surfaces de prélèvement (feuilles larges et fines, racines longues et fines).
Chêne vert (Quercus ilex).
Jean-Pol Grandmont/Wikicommons, CC BY-SA
  • Les espèces dites « conservatives », comme le sapin, le chêne pubescent ou le chêne vert. Elles sont plus efficaces dans la conservation des ressources internes (feuilles et racines moins étalées et plus épaisses pour limiter les pertes d’eau, renouvellement des organes moins fréquents pour limiter les besoins en ressources). Elles sont aussi plus tolérantes aux stress environnementaux.

Nous nous sommes alors demandé : quelles espèces poussent le plus vite, les acquisitives ou les conservatives ?

Les espèces « acquisitives », les Formule 1 du monde végétal

Des travaux antérieurs ont montré qu’en conditions contrôlées (souvent des expériences en serre) les espèces acquisitives poussent généralement très vite. En effet, leurs caractéristiques font d’elles de véritables voitures de Formule 1 végétales, où tout est optimisé pour gagner la course à la croissance.

À l’inverse, les espèces conservatives n’optimisent pas leur croissance, mais plutôt leur résistance aux contraintes de l’environnement, et grandissent souvent moins vite dans ces expériences.

Ces résultats ont conduit les écologues à bâtir une théorie selon laquelle les espèces acquisitives poussent plus vite que les espèces conservatives dans la plupart des conditions. Cependant, cette théorie a été questionnée par des chercheurs qui n’arrivaient pas à la vérifier en dehors des laboratoires, à savoir dans des forêts.

Et de fait, notre étude a montré que cette théorie n’est pas valable en conditions réelles.

Les espèces « conservatives », des championnes de rallye

En effet, dans les forêts boréales, tempérées et méditerranéennes, les espèces conservatives poussent généralement plus vite que les acquisitives.

Ce résultat s’explique par la localisation de ses forêts, le plus souvent dans des zones où les conditions de croissance sont défavorables (faible fertilité du sol, climat froid et/ou sec).

Pour filer la métaphore automobile, les forêts mondiales s’apparentent plus souvent à des chemins cabossés qu’à des circuits de course.

  • Ceci donne un avantage aux espèces conservatives, plus résistantes au stress et plus frugales dans la gestion de ressources limitées : telles des voitures de rallye, elles sont équipées pour s’accommoder des aléas de l’environnement.

  • À l’inverse, les Formule 1 acquisitives sont beaucoup moins performantes dans ces conditions défavorables, car elles ne peuvent exprimer leur potentiel que dans des conditions optimales : une sécheresse équivaut à une crevaison fatale, et un sol pauvre conduit rapidement à une panne de carburant.

D’où cet apparent paradoxe de forêts qui poussent plus vite si on privilégie des espèces supposées à croissance lente.

Dans les forêts tropicales humides, où le climat est potentiellement plus favorable à la croissance des végétaux, les deux types d’espèces d’arbres ne se départagent pas en moyenne. Pourtant, on aurait pu s’attendre à une vitesse de croissance plus élevée pour les espèces acquisitives dans ces bonnes conditions climatiques. Mais les limitations nutritives liées aux sols donnent sans doute l’avantage aux espèces conservatives dans certaines situations.

Des espèces à choisir selon les climats et selon les sols

Retenons de cette étude le rôle déterminant des conditions locales dans le choix des espèces d’arbres.

De la même façon que l’on s’est demandé sur quel type de piste la course aurait lieu avant de choisir entre la Formule 1 et la voiture de rallye, il faut analyser finement les conditions environnementales avant de choisir quel type d’espèce favoriser dans un endroit donné.

Ainsi, sous des climats favorables et des sols fertiles, les espèces acquisitives telles que les érables, les frênes ou les peupliers pousseront plus vite et donc fixeront plus de carbone que des espèces conservatives comme le chêne vert, le chêne pubescent ou de nombreux pins.

À l’inverse, sous des climats défavorables et sur des sols pauvres, ce sont les espèces conservatives qui auront le meilleur potentiel d’accumulation de carbone dans la biomasse.

Le carbone stocké par les sols, autre paramètre crucial

Notre étude ne s’est intéressée qu’à la vitesse de croissance en hauteur des arbres et au stockage de carbone dans le bois. Mais n’oublions pas que 50 % du carbone stocké en forêt l’est par les sols.

Une autre étude, réalisée dans le cadre du même projet de recherche, a mis en évidence l’effet du type d’espèce et du milieu sur le stockage de carbone dans le sol.

Quand les conditions environnementales sont défavorables, les espèces conservatives stockent davantage de carbone dans le sol, mais sous une forme peu stable. Ce carbone peut donc être relargué dans l’atmosphère si les conditions changent (exploitation forestière, incendie, réchauffement, etc.).

Quand les conditions environnementales sont favorables en revanche, les espèces acquisitives et conservatives stockent autant de carbone dans les sols. Mais le carbone issu des espèces acquisitives est plus stable et moins susceptible d’être relargué dans l’atmosphère.

Ces résultats confirment le fait qu’il faut privilégier les espèces conservatives dans les milieux défavorables, car elles y stockent le carbone de façon plus efficace, aussi bien dans la biomasse que dans le sol. À l’inverse, les espèces acquisitives doivent être préférées dans les milieux favorables, où elles peuvent pousser plus vite et stocker du carbone de manière plus durable dans le sol.

Il n’y a ainsi pas une espèce meilleure que l’autre pour stocker du carbone, mais seulement des espèces adaptées à différents types de conditions environnementales. N’oublions pas que, sur notre planète, les espèces sont déjà très bien réparties en fonction de leurs besoins. Cette étude permet donc de confirmer que la nature fait bien les choses : écoutons-la !


Le projet CARbone, Traits fonctionnels associés, et leur OptimisatioN est soutenu par l’Agence nationale de la recherche (ANR) qui finance en France la recherche sur projets. L’ANR a pour mission de soutenir et de promouvoir le développement de recherches fondamentales et finalisées dans toutes les disciplines, et de renforcer le dialogue entre science et société. Pour en savoir plus, consultez le site de l’ANR.

The Conversation

Marie Charru a reçu des financements de l’Agence Nationale de la Recherche

Laurent Augusto a reçu des financements de l’Agence nationale de la recherche (ANR).

ref. Pour des forêts à croissance rapide, favorisez les arbres à croissance lente – https://theconversation.com/pour-des-forets-a-croissance-rapide-favorisez-les-arbres-a-croissance-lente-260456

Comment une forêt peut-elle émettre plus de CO₂ qu’elle n’en capture ?

Source: The Conversation – in French – By Ariane Mirabel, Tropical ecology researcher, Cirad

Longtemps considérées comme de précieux « puits de carbone » absorbant une partie du CO2 en excès dans l’atmosphère, les forêts voient aujourd’hui ce rôle fragilisé. Certaines émettent désormais plus de CO2 qu’elles n’en captent. La cause de ce phénomène est multiple : elle tient au changement climatique, aux pressions anthropiques et à leurs conséquences.


Par le processus de photosynthèse, les plantes utilisent l’énergie lumineuse et le CO2 de l’atmosphère pour produire de la matière organique.

Les forêts contribuent donc, comme le reste du règne végétal, au piégeage de carbone dans leur biomasse : en grande partie les troncs, les branches et les feuilles – on parle alors de biomasse « aérienne », mais également les racines et les sols. Dans les forêts tropicales et tempérées, cette biomasse est principalement aérienne, tandis qu’elle est majoritairement stockée dans les sols en forêt boréale.

Avec une constante : sous tous les climats, les forêts sont les écosystèmes qui stockent le plus de carbone. Cependant, l’évolution de ce stock de carbone dépend de la dynamique des forêts.

En effet, même si du carbone est séquestré lors de sa croissance, une plante (et donc un arbre), comme tout organisme vivant, respire, et va à son tour émettre du CO2 dans l’atmosphère. Par ailleurs, les végétaux se décomposent après leur mort. À terme et dans la plupart des cas, le carbone stocké est donc restitué à l’atmosphère sous forme de carbone atmosphérique (excepté sous certains climats boréaux où la décomposition n’est pas totale et la biomasse s’accumule dans les sols, par exemple sous forme de tourbières).

Pour avoir un effet vertueux sur le climat, il faut donc que les forêts séquestrent davantage de carbone (dans les troncs, les branches, les racines et les sols) qu’elles n’en émettent (à travers la respiration et la mort des végétaux). On parle alors pour les décrire de « puits de carbone » naturels.

Mais sous certaines conditions, les forêts peuvent avoir un bilan carbone net émetteur : elles émettent davantage de CO2 qu’elles n’en captent. Comment cela est-il possible et pourquoi ? Une telle situation est-elle amenée à se généraliser sous l’effet du changement climatique ? Tour d’horizon.


À lire aussi :
Que sont les « puits de carbone » et comment peuvent-ils contribuer à la neutralité carbone en France ?


Les forêts, des puits de carbone… à certaines conditions

Dans une forêt à l’équilibre, qui ne serait pas perturbée par des changements environnementaux, d’origine naturelle ou anthropique, les flux de carbone liés à la croissance et à la mortalité s’équilibrent. Dans le bilan global, il n’y a dans ce cas alors ni stockage ni émission de carbone.

Le puits de carbone forestier, bien documenté depuis la fin du XXe siècle, provient ainsi des dynamiques de reforestation, de récupération après des perturbations antérieures et de l’augmentation de la concentration en CO2 de l’atmosphère, qui conduisent les écosystèmes forestiers vers un nouveau point d’équilibre, non encore atteint précédemment.

Les feux de forêt ou la déforestation (conversion de forêts en zones agricoles ou urbaines), à l’inverse, déstockent le carbone forestier et génèrent d’importantes émissions de carbone atmosphérique.

Mais au-delà de la disparition des forêts, même lorsqu’un couvert forestier est maintenu, c’est bien le bilan net des flux de carbone qui va déterminer si une forêt stocke du carbone ou si elle en émet.

Des forêts qui stockent de moins en moins de carbone

Dans certaines conditions, en effet, des forêts peuvent avoir un bilan carbone émetteur : plutôt que de stocker le carbone, elles le déstockent. Pourquoi ?

Une première explication tient à la balance croissance-mortalité des arbres. En effet, tout facteur augmentant la mortalité – ou limitant la croissance des arbres (sécheresses, maladies, ravageurs) – va induire une réduction du stockage de carbone, voire un déstockage.

Or, depuis quelques années, on observe une diminution globale de la croissance des arbres et une augmentation de leur mortalité, en lien avec les sécheresses plus longues et plus intenses.

Ce déclin du rôle de puits de carbone des forêts a été observé notamment en Amazonie. Les forêts matures, à l’équilibre, stockent moins de carbone depuis les années 2000 : la quantité moyenne de carbone stockée par hectare a chuté d’environ 30 % entre 2000 et 2010.

Au contraire, en Afrique centrale, le stockage de carbone est resté constant entre 2000 et 2010. Cette différence s’expliquerait par le fait que les essences d’arbres qu’on retrouve dans les forêts tropicales africaines seraient davantage adaptées à des épisodes de sécheresse et de fortes températures.


À lire aussi :
Les forêts tropicales, des « puits de carbone » hautement vulnérables


Les forêts changent de composition sous l’effet du changement climatique

Les mélanges d’espèces végétales qui composent les forêts ont donc un rôle majeur. Tout changement dans cette composition, dans une logique d’adaptation au changement climatique ou aux pressions anthropiques, est donc susceptible de modifier le bilan carbone d’une forêt.

Lorsqu’un arbre meurt, il n’est pas toujours remplacé par un autre de la même espèce.

En effet, la quantité de carbone stockée par une forêt dépend aussi de la couverture forestière et de la densité du bois des arbres, qui diffèrent pour chaque espèce d’arbre.

De tels changements de composition peuvent subvenir sous toutes les latitudes. Ils existent également en forêts tempérées, mais sont particulièrement flagrants dans les forêts boréales et tropicales :

  • En forêt boréale, les arbres peuvent être remplacés par des espèces arbustives ou herbacées, plus résistantes à la sécheresse, mais plus petites et moins denses.

  • En forêt tropicale, les arbres de forêt mature, de grande taille et à bois dense, peuvent être remplacés par des espèces de forêt secondaire, plus petites et à bois moins dense.

Dans les deux cas, cela peut entraîner une baisse des quantités de carbone stocké.

Le cas particulier des forêts tempérées

Qu’en est-il pour les forêts tempérées ? En Europe, une meilleure gestion et des politiques de reforestation ambitieuses ont permis d’augmenter les quantités de carbone stockées chaque année entre 1990 et 2005.

Cependant, les effets combinés des sécheresses, tempêtes, maladies et ravageurs, ont augenté la mortalité des arbres et diminué leur croissance. De fait, la quantité de carbone stockée chaque année en forêt tempérée, en tenant compte des variations de croissance et de l’augmentation des surfaces forestières, a diminué au cours des dernières décennies : aux États-Unis, la baisse a été de 10 % entre 2000 et 2010. En Europe, elle avoisine 12 %.

En France, les dernières données de l’inventaire forestier indiquent que sur la période 2014-2022, les forêts métropolitaines ont absorbé 39 millions de tonnes de CO2 par an en moyenne, tandis qu’elles en absorbaient 63 millions de tonnes de CO2 par an au cours de la période 2005-2013.


À lire aussi :
La forêt française et ses sols pour limiter les gaz à effet de serre


L’influence délétère des feux de forêt

Le changement climatique alimente des conditions climatiques particulièrement propices aux feux de forêt et aux invasions de ravageurs

Or, les feux de forêt sont des facteurs aggravants de la dégradation du puits de carbone forestier : non seulement ils entraînent des émissions massives de gaz à effet de serre, mais ils accélèrent aussi les changements de composition des forêts, qui peuvent alors mettre des décennies à retrouver leur état d’origine.

Dans certains cas, il s’agit même de transition vers des écosystèmes non forestiers : les forêts disparaissent purement et simplement.

En forêts boréales, cela affecte d’ores et déjà le stockage du carbone. Celui-ci est en nette diminution depuis les années 90.

  • En Russie, par exemple, les forêts dont devenues émettrices dans les années 2010.

  • Au Canada, elles étaient encore neutres dans les années 1990, mais sont devenues émettrices entre les années 2000 et 2010.

Ce phénomène devrait s’amplifier et se répéter à l’avenir, car des saisons d’incendies telles que celle connue par le Canada en 2023 sont appelées à se multiplier.

Dans ces zones normalement froides, le changement climatique peut aussi entraîner le dégel et l’assèchement des sols, ce qui conduit à une dégradation accélérée du carbone organique qu’ils contiennent, et à un déstockage plus rapide de carbone. Les feux de forêt contribuent aussi à consumer la matière accumulée.

À l’échelle globale, l’absorption de carbone par les sols en forêt boréale a ainsi diminué de 30 % entre 2000 et 2010. Ces flux de carbone sont difficiles à évaluer et variables dans le temps et l’espace, mais quasiment toutes les études pointent vers une réduction du stockage de carbone organique dans ces sols.

Mais les feux de forêt ne dépendent pas que des conditions climatiques : en forêts tempérées, les activités humaines sont responsables de la quasi-totalité des départs de feux.

En 2022, à l’échelle de l’Europe, 785 000 hectares de forêts ont brûlé, ce qui représente plus du double de la moyenne entre 2006 et 2021. Cette année 2025, le Portugal, la Grèce et la Turquie ont enregistré de nouveaux records d’incendies. La France n’est pas épargnée : 17 000 hectares ont brûlé en quelques jours dans l’Aude.

Près de 30 % de carbone en moins entre 1990 et 2010

Que retenir de tout ceci ? Si les causes de réduction du stock de carbone forestier sont identifiées aux différentes latitudes, il est difficile de prédire finement l’évolution à venir des forêts et les conséquences qui en découleront.

Ainsi, aucune forêt n’est épargnée : toutes sont susceptibles de devenir émettrices de carbone suite aux effets combinés des activités anthropiques et du changement climatique.

Globalement, il est estimé que la quantité de carbone stockée chaque année par les forêts dans le monde a diminué d’environ 30 % entre 1990 et 2010. Cette tendance risque de se poursuivre.

La meilleure façon d’endiguer ce déclin reste de préserver les forêts existantes.
Dans les forêts gérées par l’humain, le maintien du stock de carbone forestier et/ou l’accompagnement des transitions des peuplements d’arbres vers des espèces adaptées aux nouvelles conditions climatiques est un nouvel enjeu de la gestion forestière à l’échelle planétaire.

The Conversation

Ariane Mirabel a reçu des financements de recherche publics.

Géraldine Derroire a reçu des financements de recherche publics.

Plinio Sist a reçu des financements de la recherche publique.

Stéphane Traissac a reçu des financements de la recherche publique française

ref. Comment une forêt peut-elle émettre plus de CO₂ qu’elle n’en capture ? – https://theconversation.com/comment-une-foret-peut-elle-emettre-plus-de-co-quelle-nen-capture-265423