Measuring Colorado’s mountains one hike at a time

Source: The Conversation – USA – By Eric Gilbertson, Associate Teaching Professor of Mechanical Engineering, Seattle University
Using lightweight tools, Eric Gilbertson hikes the world’s tallest mountains to measure their heights. Elijah Gendron

In the middle of a chilly October night in 2025, my two friends and I suited up at the Cottonwood Creek trailhead and started a trek into the Sangre de Cristo mountains of Colorado. It was a little below freezing as we got moving at 1:30 a.m., and the Moon illuminated the snowy mountaintops above us.

Our packs were a bit heavier than normal because we were hauling highly accurate surveying equipment to the summits of two peaks, each over 14,000 feet (4,267.2 meters). The peaks, Crestone and East Crestone, were close enough in height, with a short enough saddle in between, that only the taller of the two would count as a true 14er and the other as a sub-peak.

Crestone had traditionally been thought to be taller and sees hundreds of ascents each year. East Crestone, traditionally believed to be shorter, sees only a fraction as many ascents. Colorado has 58 mountain peaks over 14,000 feet that peakbaggers consider 14ers. For locals and visitors alike, bagging a 14er is a sport, and some people post reports about having climbed all 58.

I wanted to measure which was taller, since I suspected previous measurements people had trusted for years might be erroneous.
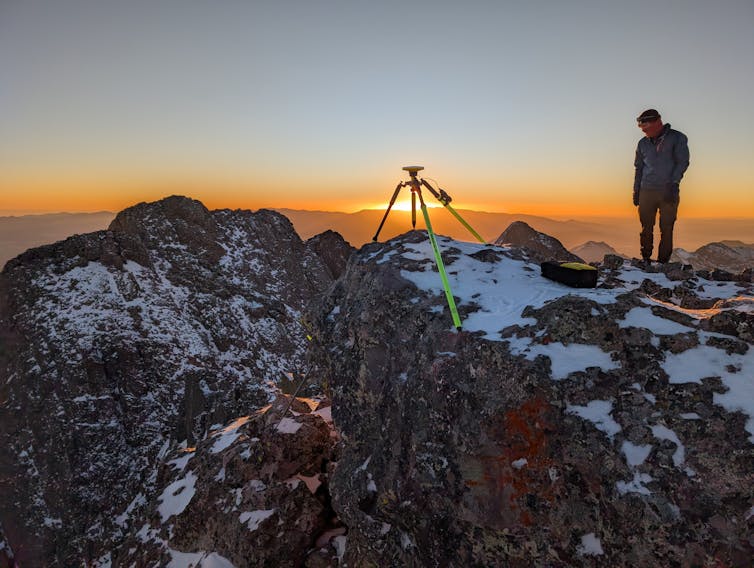
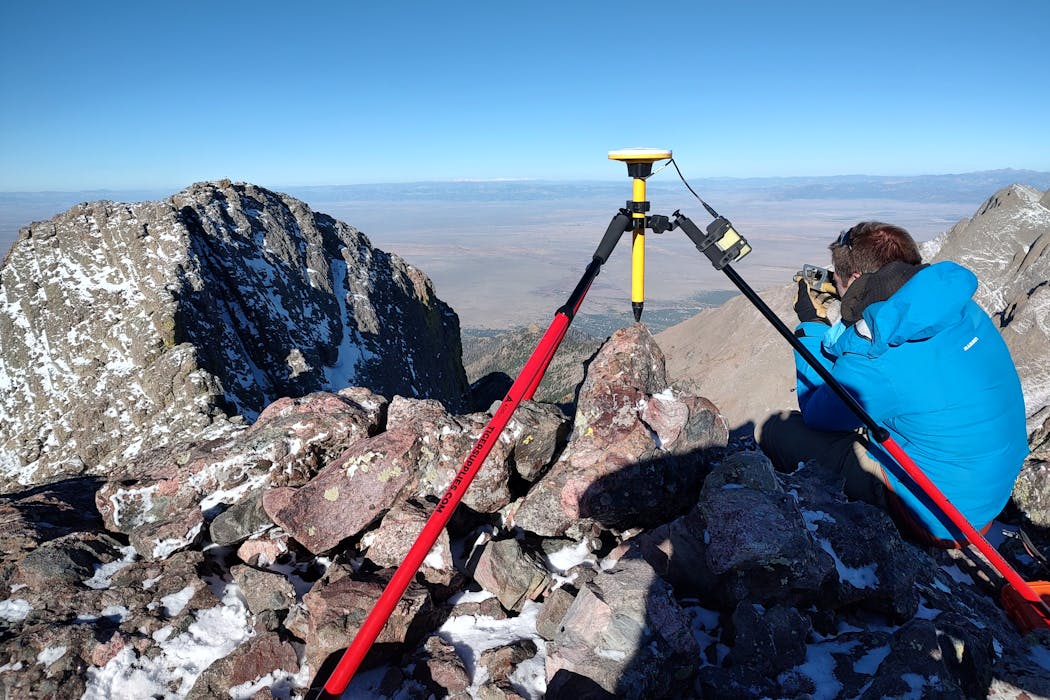
A man stands near a tripod at the top of a mountain.
GPS allows Eric Gilbertson to measure the peaks of Crestone and East Crestone in Colorado in October 2025.
Eric Gilbertson

I teach mountain surveying, and I climb and research mountains around the world for fun. I’m trying to climb the highest mountain in every country on Earth. I have so far climbed 147 of 196, including tough, high-altitude technical ones such as K2 without supplemental oxygen in Pakistan and Pobeda in Kyrgyzstan.

Through my experience climbing, I discovered that not all countries in the world have been surveyed accurately enough to know the country’s true high point. The high point is geographically significant, as it’s the highest natural point or peak in the country, state or province. Often, high points are a source of national or state pride. I taught myself surveying to determine and verify these high points on my own.

Discovering high points around the world

I’ve so far discovered new high points in seven countries: Colombia – Pico Simón Bolívar; Saudi Arabia – Jabal Ferwa; Uzbekistan – Alpomish; Togo – Mount Atilakoutse; Gambia – Sare Firasu Hill; Guinea Bissau – Mount Ronde; and Botswana – Monalanong Hill.
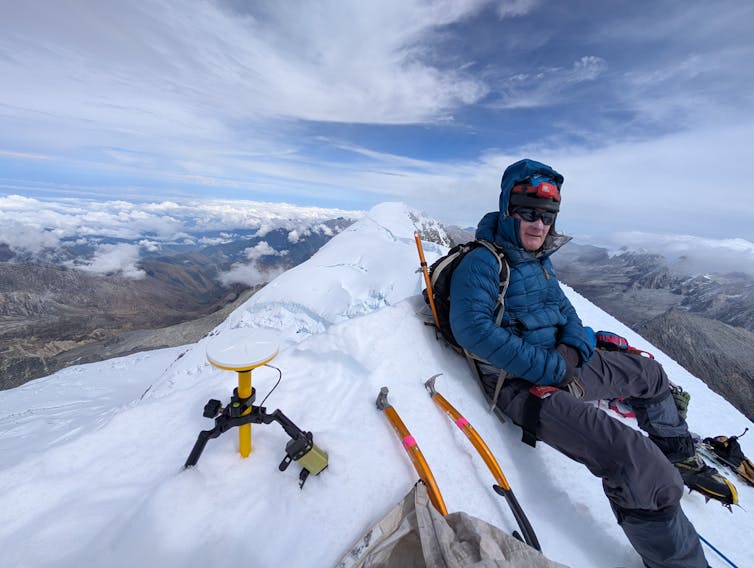
A man in cold-weather clothing sits on an icy mountain peak.
Ginge Fullen, a climbing partner of Eric Gilbertson, sits atop the peak of Pico Simon Bolivar in Colombia in December 2024.
Eric Gilbertson

I’ve surveyed over 60 peaks in the U.S. and Canada. In 2025 I discovered a new state high point in Michigan, Mount Curwood, at 1,979.3 feet (603.3 meters), and a new provincial high point of Nova Scotia, Western Barren, at 1,743.2 feet (531.3 meters).

I’ve determined the 100 highest peaks in Washington state, where I live and work, and studied how climate change is affecting the elevations of ice-capped peaks. My research showed that, while historically the contiguous U.S. had five ice-capped peaks, only two remain – Liberty Cap and Colfax, both in Washington state. Mount Rainier used to have as its highest point an ice dome named Columbia Crest on the western rim of the summit crater. But since 1998, Columbia Crest has melted more than 20 feet (6 meters) and is no longer the highest point on the mountain. The highest point is now a rock 436 feet (133 meters) to the south, on the southwest edge of the summit crater.
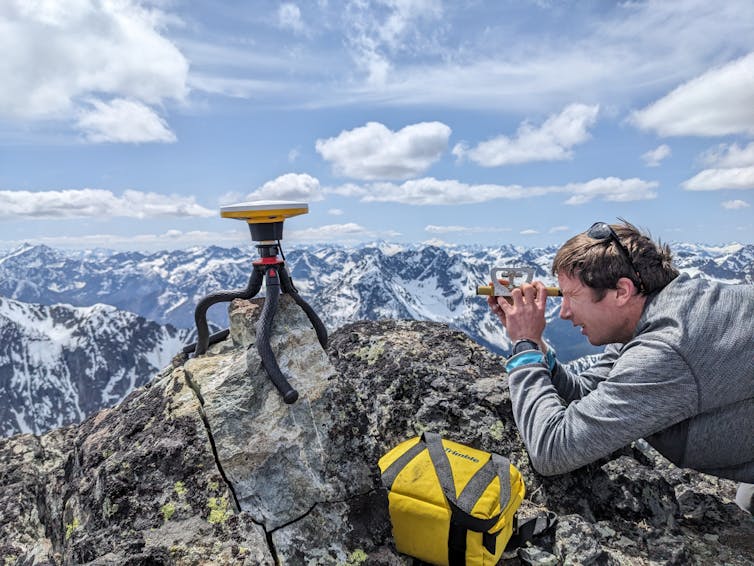
A small flat instrument sits on a tripod near a man who holds a measuring device to his eyes.
At the very top of South Mirror Image Peak in Washington, Eric Gilbertson uses an Abney level to measure nearby mountain heights.
Matthew Gilbertson

How to survey mountain high points

Surveying mountains is challenging due to the altitude, long approaches, difficult weather conditions and technical climbing. To get accurate surveying equipment to the summits requires ingenuity and specialized gear. Equipment needs to be as light as possible and adaptable to tricky terrain. For these reasons, very few mountains have been surveyed to the level of accuracy I can attain.

Historically, measurements have generally been made from a distance with theodolites. These are mechanical devices that can measure an angle up to a mountain summit very accurately. The distance to the mountain can be measured by other means, and trigonometry can be used with the distance and angle to calculate the summit elevation. But if the measurement is taken too far away, the error in elevation can be high. Theodolites are heavy and not easy to carry close to a peak.
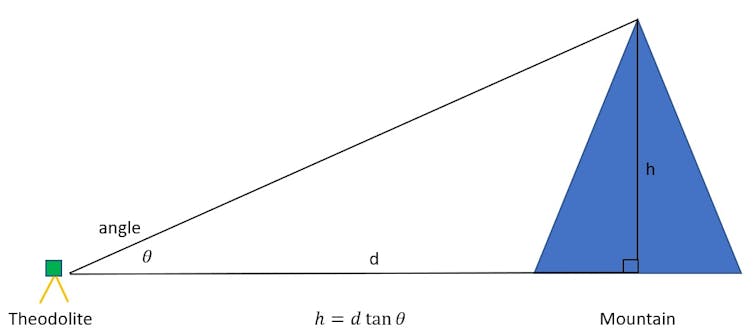
An illustration shows how a theodolite measures angles.
Schematic diagram of how a theodolite is used to measure an angle to the summit of a mountain.
Eric Gilbertson

I sometimes carry a 30-pound (13.61 kg) theodolite to a summit, but if the mountain is technical, this is challenging and requires complicated rope systems to haul it up. More often I bring an Abney level, which is a lighter mechanical device that also measures angles. I bring this to a summit to measure relative angles between nearby points to identify which is the highest point on the mountain.
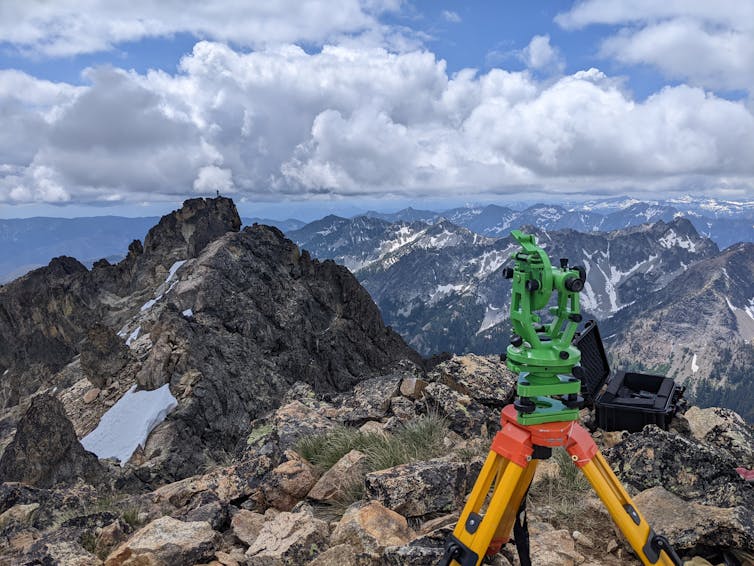
A greean machine with yellow tripod legs sits on a mountain top.
A theodolite is a mechanical devices that can measure angles up to a summit very accurately. Here one is used on Cardinal Peak in Washington in June 2023.
Eric Gilbertson

I then use a highly accurate, survey-grade GPS to measure the absolute elevation of the highest point. The GPS requires an hour or more to get an accurate measurement, so it wouldn’t make sense timewise to measure many nearby points with this device. I’ve found time is usually limited when surveying a summit, due to incoming storms or approaching darkness when descents need to be made in daylight for safety. This is why I first identify the highest point with an Abney level or theodolite.

Many satellites overhead send data down that is collected by the GPS device and used to calculate the device’s position. To save weight, I use a device that then sends measurements over Bluetooth to my phone instead of requiring a dedicated computer.

A GPS receiver generally needs to be mounted on a vertical rod that touches the exact summit. I measure the GPS height, subtract the rod height, and that gives the summit height. To keep the rod perfectly vertical I use a tripod, and this also requires innovation.

A man with a red helmet and jacket adjusts a small device on the top of a mountain.
Eric Gilbertson uses a GPS to measure East Fury in Washington.
Courtesy of Ross Wallette

Sometimes a summit is so sharp that regular tripod legs aren’t long enough to touch the ground. In this case, I strap on hiking poles to extend the legs. Another solution is to use a tripod with flexible legs, and I mold the legs to conform to the shape of a sharp boulder. This is what I used to measure the high point of Uzbekistan.

Another tool I use is LiDAR, which stands for light detection and ranging. This works by an airplane flying over a mountain and bouncing light signals off the summit. By using the plane’s location and the time it takes the signal to bounce back, the mountain’s elevation can be calculated.

Colorado 14ers

All measurements can have errors. I traveled to Colorado because I suspected LiDAR measurements of Crestone Peak, considered a 14er, might be erroneous. LiDAR measurements have been taken for nearly all mountains in Colorado, and these measurements are generally the most accurate available for mountain elevations.

LiDAR measurements hit the ground every few feet of horizontal spacing and can miss the top of sharp summits, leading to an underestimate of summit height. They can also hit things such as bushes, leading to an overestimate of summit height.

LiDAR data showed Crestone Peak and East Crestone within a few feet of the same height. But, interestingly, it showed a 3-4 foot (0.9-1.2 meter) spike on the top of Crestone. I climbed Crestone in 2020 while doing the Rocky Mountain Slam, a challenge to climb all the Colorado 14ers, Wyoming 13ers and Montana 12ers in two months, and knew the summit was pretty flat. I speculated that spike could have easily been a person, which meant the LiDAR elevation of Crestone might be too high.

East Crestone has a sharp boulder on the summit, which LiDAR could easily miss because of the horizontal gaps between measurements. So that elevation was possibly too short. In Colorado a point needs 300 feet (91.44 meters) of prominence to count as a separate peak. Other states have different rules, like in Washington where 400 feet (121.92 meters) is required. Prominence is a measure of how high a peak sticks up above a saddle connecting it to a taller peak. The saddle between Crestone and East Crestone is short enough that only the taller of them is a true peak and the other is a sub-peak.

On East Crestone I first set up a tall tripod, but the wind blew it down, nearly over a cliff. I switched it out with a shorter one, which was more stable.
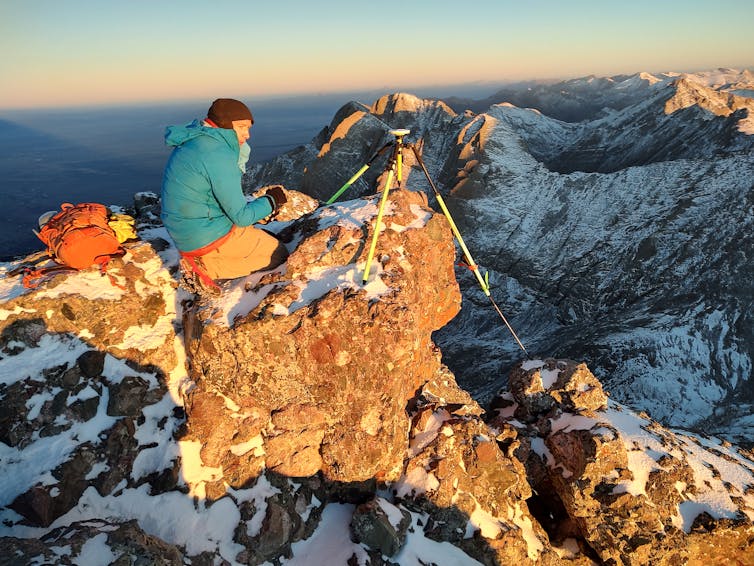
A man in a green jacket sits near a device on a tripod on the top of a mountain.
Eric Gilbertson hiked Crestone, one of Colorado’s 14ers, to determine its true height.
Elijah Gendron

I then scrambled over to Crestone Peak and mounted another identical GPS device. That summit was on the edge of a cliff, and I needed to extend one tripod leg with a hiking pole so it could touch the ground.

I logged data for over two hours with both devices simultaneously. This ensured both were receiving the same satellite signals – so any atmospheric distortion would be the same – and that enough data was logged so I could get elevations accurate to the nearest inch. This gave me a lot of time to admire the views and take pictures, but I also needed to check on the equipment every 5-10 minutes to ensure it was working properly.

After packing up, hiking down and flying home to Seattle, I spent a few weeks poring over the data. The results showed East Crestone is 0.3 feet (0.09 meters) taller than Crestone, with more than 99.9% confidence that East Crestone is taller.

This means Colorado has a new 14er: East Crestone. Crestone is, in fact, a sub-peak. Discussions are ongoing about whether this means the 14ers list that peakbaggers climb should retain Crestone and add East Crestone to be 59 peaks, or whether East Crestone should replace Crestone so the list stays at 58 peaks.

I’m planning to continue my work surveying mountains in Colorado and around the world to determine accurate summit elevations. My next plan is surveying several country high points in Africa this winter. The Benin country high point is still not known, and I hope to solve that mystery next.

Read more of our stories about Colorado.

The Conversation

Eric Gilbertson receives funding from The American Alpine Club.

ref. Measuring Colorado’s mountains one hike at a time – https://theconversation.com/measuring-colorados-mountains-one-hike-at-a-time-269343
Declaration of Independence’s promises ring out today as loudly as they did for Lincoln, FDR and through 249 years of US history

Source: The Conversation – USA – By Graeme Mack, Visiting Assistant Professor of History, University of Richmond

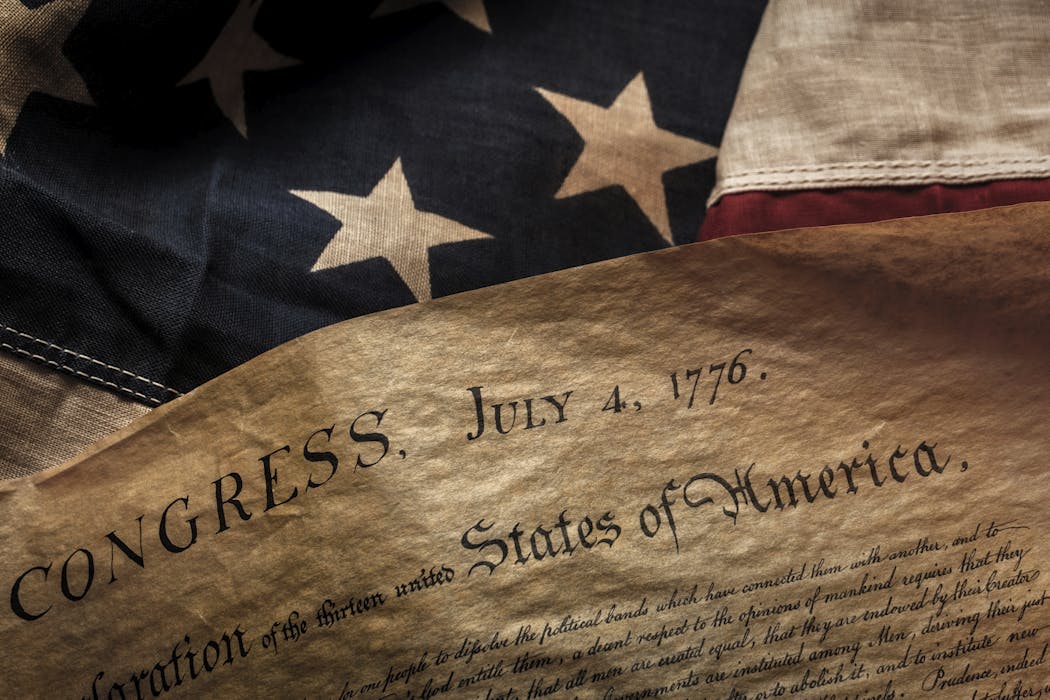
The Declaration of Independence declares the nation’s credo, that ‘all men are created equal.’ Tetra Images/Getty Images

The Declaration of Independence’s 250th anniversary in 2026 is certain to be a time of national reflection.

Americans tend to look to the Constitution to assess whether the nation is living up to its founding principles when navigating major social and political issues.

But it is the declaration, signed on July 4, 1776, that declares the nation’s credo, that “all men are created equal.”

Throughout history, Americans have turned to the declaration for guidance about what the nation should stand for.

As a historian of the United States and the coordinator for the University of Richmond’s Forging a New Nation initiative, which commemorates the Declaration of Independence’s 250th anniversary, I have been thinking a lot about this phenomenon.

Particularly during times of social and political upheaval, Americans have sought out the Declaration of Independence when they wanted to remedy contemporary problems and create new visions for the country’s future. Many of the nation’s greatest leaders have praised and memorialized its rhetoric and ideas in the promotion of their own.

Inalienable rights?

During the turbulent 1850s, the divisive issue of slavery permeated every facet of American life and challenged basic precepts of American freedom.

In his 1852 speech “What to the Slave is the Fourth of July?Frederick Douglass, the formerly enslaved abolitionist, used the declaration to set a standard for American society. As a Black American, Douglass insisted he was “not included within the pale” who enjoyed the “inalienable rights” articulated in the declaration.

Nonetheless, the “great principles of the Declaration” gave Douglass hope and cause for optimism. He predicted that the “glorious hour” would soon arrive when all Americans would be defined “by equal birth.”

Conceived in liberty

An antique photo of a crowd of soldiers and civilians listening to someone talking in the middle.
A photo by Mathew Brady of Abraham Lincoln – center, bareheaded – giving the Gettysburg Address in 1863.
Bettman/Getty Images

In its 1857 Dred Scott v. Sanford decision, the Supreme Court denied Black Americans the rights of citizenship.

Abraham Lincoln denounced the decision and countered by defining a more capacious view of American freedom based on the declaration.

Lincoln told one audience that Thomas Jefferson and the signers of the declaration “set up a standard maxim for free society,” which they “intended to include all men” and to be “constantly looked to, constantly labored for.”

Their goal, Lincoln said, was “augmenting the happiness and value of life to all people of all colors everywhere.”

As civil war ravaged the country and claimed thousands of American lives, Lincoln again drew on the declaration to articulate a vision for the country as president.

In his 1863 Gettysburg Address, commemorating the dead on that Pennsylvania battlefield, Lincoln described the United States as a “nation, conceived in liberty, and dedicated to the proposition that all men are created equal.”

The nation, he said, was undergoing a “new birth of freedom” as it waged war on slavery and defended its government against domestic rebellion.

Self-evident truth

Seventy years later, the declaration provided inspiration for President Franklin D. Roosevelt as he steered the nation through a crippling economic depression and the run-up to a world war. Roosevelt advocated for building America’s first social safety net by drawing on the declaration.

Reflecting Roosevelt’s aims, the 1936 Democratic Party platform illustrated this rhetorical strategy, borrowing from the declaration at its very beginning: “We hold this truth to be self evident – that government in a modern civilization has certain inescapable obligations to its citizens.”

During his 1944 State of the Union Address, Roosevelt said the nation was built on the rights embedded in the Declaration of Independence and the Constitution. But, he argued, “true individual freedom cannot exist without economic security and independence.”

All created equal

In his 1963 “I Have a Dream” speech, Martin Luther King Jr. drew on the declaration to define America’s promises to all its citizens.

Amid the political and social upheaval of the 1960s, the Rev. Martin Luther King Jr. drew directly and self-consciously on the declaration.

In his 1963 “I Have a Dream” speech, King defined an America that “guaranteed unalienable rights of life, liberty and the pursuit of happiness” to its citizens.

Though the nation had “defaulted on this promissory note insofar as its citizens of color are concerned,” King said, the declaration still offered him hope: “I have a dream that one day this nation will rise up and live out the true meaning of its creed: We hold these truths to be self evident, that all men are created equal.”

In 2025, Americans saw the deployment of U.S. troops in major cities, as well as mass immigrant deportations. These changes have upended communities and challenged basic norms of civil society. They have also challenged Americans’ understanding of themselves as a nation of immigrants.

With the declaration’s anniversary coming up at a time when so much about contemporary society and politics are being contested, Americans may well return once again to this founding document to define themselves as a people and a nation.

The Conversation

Graeme Mack does not work for, consult, own shares in or receive funding from any company or organization that would benefit from this article, and has disclosed no relevant affiliations beyond their academic appointment.

ref. Declaration of Independence’s promises ring out today as loudly as they did for Lincoln, FDR and through 249 years of US history – https://theconversation.com/declaration-of-independences-promises-ring-out-today-as-loudly-as-they-did-for-lincoln-fdr-and-through-249-years-of-us-history-269355

Everything everywhere all at once: How Zohran Mamdani campaigned both online and with a ground game

Source: The Conversation – USA – By Stuart Soroka, Professor, Communications and Political Science, University of California, Los Angeles

New York mayoral candidate Zohran Mamdani and U.S. Rep. Pramila Jayapal meet voters to go door-knocking in Jackson Heights on Sept. 14, 2025. Selcuk Acar/Anadolu via Getty Images

Accounts of Zohran Mamdani’s campaign for New York City mayor have highlighted both his online presence and his ground game.

Mamdani won the general election with 50.4% of the vote, a larger share than was predicted by most polls, and his get-out-the-vote campaign has received some of the credit. Mamdani claims that his campaign had over 100,000 volunteers knocking on doors across New York City.

This focus on on-the-ground mobilization stands out given the increasing attention devoted to online campaigning over the past 15 years.

Particularly during that time period, online platforms have been a major focus of political campaigns and campaign research. Targeted advertising and new media strategies are increasingly viewed as central to campaign success. So is coverage of the campaign by legacy and social media more generally.

Moreover, solid empirical evidence of the effectiveness of door-to-door canvassing is limited. Recent work finds very few effects of in-person canvassing, except in very specific circumstances. One recent paper suggests that door-to-door canvassing by the candidate can make a difference to election outcomes. But in a race in New York City, it is not likely that Mamdani himself was able to reach enough voters to make a difference.

How much did Mamdani’s ground game contribute to his victory? As a political communication scholar, I know that assessing the impact of different methods used by political campaigns is difficult – in part because political campaigns include multiple lines of communication.

‘Hybrid’ campaigns

No campaign exists in isolation — nearly every candidate’s campaign occurs alongside opposing candidates’ campaigns. The effects of one campaign are often masked by the countering effects of the other.

The size of a campaign on one platform also tends to be correlated with the size of that candidate’s campaign on other platforms. When television advertising increases alongside social media advertising and door-to-door canvassing, identifying the effects of any single platform can be difficult.

Clever research designs are in some instances able to identify effects. These generally find that the impact of not just door-knocking but also ads and online advertising can be relatively limited.

In the modern technological environment, the impact of any single aspect of a campaign may be especially difficult to assess. Campaigning increasingly occurs in what researchers have called a “hybrid media” environment. Campaigns are waged in person, on the news and across multiple social media.

Each of these platforms comes with different advantages and disadvantages. Each also prioritizes different kinds of information.

Plainly stating your policy platform may work for coverage of a campaign stop on the evening news. But if you want that policy to go viral on TikTok, then you may need to add a dance – or an influencer.

Find volunteers online, send them knocking

Candidates have increasingly recognized the need to tailor messages for different communication platforms, such as television ads, Facebook posts and TikToks, building hybrid campaigns that attempt to spread a message across multiple, different spaces.

This interactivity across platforms has been especially evident in postelection assessments of the Mamdani campaign. His social media campaign was adept at producing the kinds of content that attract attention online. That campaign also appears to have been able to convert online engagement into real-world activism, including door-to-door canvassing.

There have been growing concerns among academics and campaign organizers about “slacktivism” — activism that amounts to one or two clicks online but nothing more. One worry is that a quick online endorsement may in some instances give people a sense that they have done their share and limit more active forms of engagement. The Mamdani campaign appears to have overcome this problem, at least in part.

But 100,000 people knocking on doors probably does not happen without the success of an online campaign. Finding and mobilizing campaigners was one important focus of Mamdani’s engagement online, after all.

Do it yourself − then repeat on socials

In-person campaigning by Mamdani, on the street and in the taxi line, is almost certainly made more effective through circulation on Instagram and TikTok.

Using mass media to broadcast campaign stops is not new, of course.

The construction of campaign stops that produce good social media content is becoming more common, however. The ways in which campaigns unfold in person are increasingly intertwined with the way they unfold online.

In this way, the Mamdani campaign may have been a textbook example of a modern hybrid campaign and an illustration of the coevolution of digital and on-the-ground campaigning.

To be clear, the success of the Mamdani campaign is probably not about his online presence or his ground game, but both at the same time.

The Conversation

Stuart Soroka research has been funded from the National Science Foundation and the Social Sciences and Humanities Research Council of Canada.

ref. Everything everywhere all at once: How Zohran Mamdani campaigned both online and with a ground game – https://theconversation.com/everything-everywhere-all-at-once-how-zohran-mamdani-campaigned-both-online-and-with-a-ground-game-269693

Down-ranking polarizing content lowers emotional temperature on social media – new research

Source: The Conversation – USA – By Tiziano Piccardi, Assistant Professor of Computer Science, Johns Hopkins University

Social media posts that stoke division don’t have to top your feed. Gama5/iStock via Getty Images

Reducing the visibility of polarizing content in social media feeds can measurably lower partisan animosity. To come up with this finding, my colleagues and I developed a method that let us alter the ranking of people’s feeds, previously something only the social media companies could do.

Reranking social media feeds to reduce exposure to posts expressing anti-democratic attitudes and partisan animosity affected people’s emotions and their views of people with opposing political views.

I’m a computer scientist who studies social computing, artificial intelligence and the web. Because only social media platforms can modify their algorithms, we developed and released an open-source web tool that allowed us to rerank the feeds of consenting participants on X, formerly Twitter, in real time.

Drawing on social science theory, we used a large language model to identify posts likely to polarize people, such as those advocating political violence or calling for the imprisonment of members of the opposing party. These posts were not removed; they were simply ranked lower, requiring users to scroll further to see them. This reduced the number of those posts users saw.

We ran this experiment for 10 days in the weeks before the 2024 U.S. presidential election. We found that reducing exposure to polarizing content measurably improved participants’ feelings toward people from the opposing party and reduced their negative emotions while scrolling their feed. Importantly, these effects were similar across political affiliations, suggesting that the intervention benefits users regardless of their political party.

This ‘60 Minutes’ segment covers how divisive social media posts get more traction than neutral posts.

Why it matters

A common misconception is that people must choose between two extremes: engagement-based algorithms or purely chronological feeds. In reality, there is a wide spectrum of intermediate approaches depending on what they are optimized to do.

Feed algorithms are typically optimized to capture your attention, and as a result, they have a significant impact on your attitudes, moods and perceptions of others. For this reason, there is an urgent need for frameworks that enable independent researchers to test new approaches under realistic conditions.

Our work offers a path forward, showing how researchers can study and prototype alternative algorithms at scale, and it demonstrates that, thanks to large language models, platforms finally have the technical means to detect polarizing content that can affect their users’ democratic attitudes.

What other research is being done in this field

Testing the impact of alternative feed algorithms on live platforms is difficult, and such studies have only recently increased in number.

For instance, a recent collaboration between academics and Meta found that changing the algorithmic feed to a chronological one was not sufficient to show an impact on polarization. A related effort, the Prosocial Ranking Challenge led by researchers at the University of California, Berkeley, explores ranking alternatives across multiple platforms to promote beneficial social outcomes.

At the same time, the progress in large language model development enables richer ways to model how people think, feel and interact with others. We are seeing growing interest in giving users more control, allowing people to decide what principles should guide what they see in their feeds – for example the Alexandria library of pluralistic values and the Bonsai feed reranking system. Social media platforms, including Bluesky and X, are heading this way, as well.

What’s next

This study represents our first step toward designing algorithms that are aware of their potential social impact. Many questions remain open.

We plan to investigate the long-term effects of these interventions and test new ranking objectives to address other risks to online well-being, such as mental health and life satisfaction. Future work will explore how to balance multiple goals, such as cultural context, personal values and user control, to create online spaces that better support healthy social and civic interaction.

The Research Brief is a short take on interesting academic work.

The Conversation

This research was partially supported by a Hoffman-Yee grant from the Stanford Institute for Human-Centered Artificial Intelligence.

ref. Down-ranking polarizing content lowers emotional temperature on social media – new research – https://theconversation.com/down-ranking-polarizing-content-lowers-emotional-temperature-on-social-media-new-research-271071

L’« effet Lazare », ou quand certains êtres vivants ressurgissent après des millions d’années

Source: The Conversation – France (in French) – By Violaine Nicolas Colin, Maitre de conférence en systématique et phylogéographie, Muséum national d’histoire naturelle (MNHN)

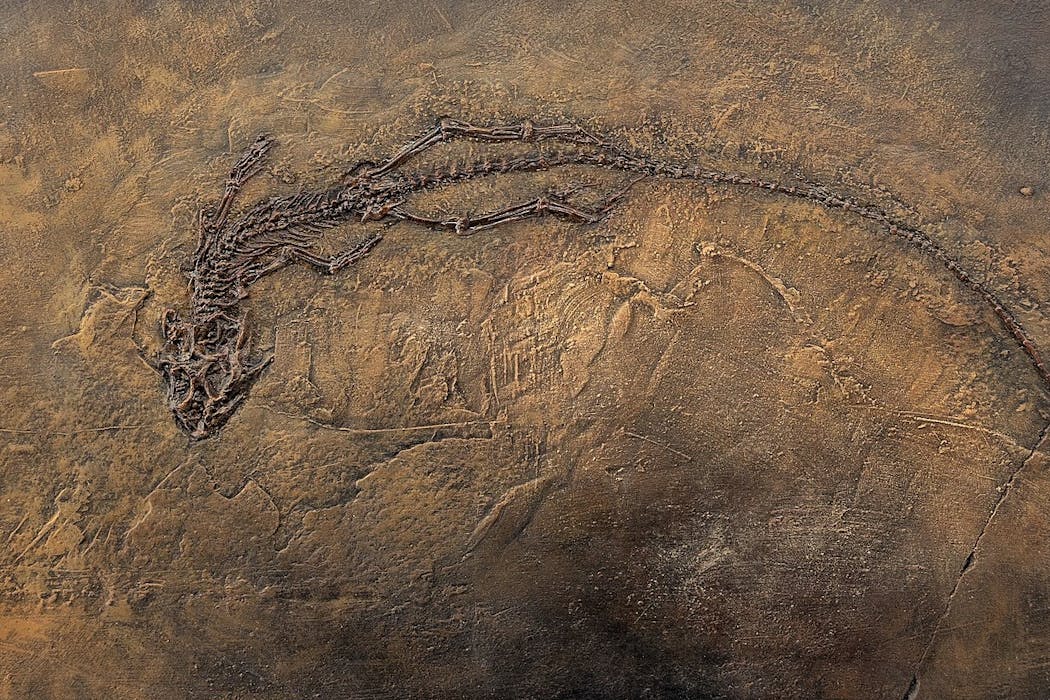
Les lézards iguanidés ( ici, _G. longicaudatus_) étaient très répandus et diversifiés en Europe durant l’Éocène (entre 56 millions et 33,9 millions d’années). On les pensait totalement disparus du continent après la transition Éocène-Oligocène. Jusqu’à la découverte, en 2012, de spécimens du genre _Geiseltaliellus_ dans le sud de la France. Chris Woodrich, CC BY

Nommé d’après la figure biblique revenue d’entre les morts, l’« effet Lazare » désigne un phénomène bien plus fréquent qu’on ne le pense : la réapparition de certains groupes d’organismes que l’on croyait éteints.


Tout le monde connaît Lazare, ce personnage du Nouveau Testament que Jésus aurait ramené à la vie. C’est de cette image symbolique qu’est né le terme d’« effet Lazare », utilisé aujourd’hui dans différents domaines de la biologie.

En paléontologie et en phylogénie (l’étude des relations évolutives entre les organismes), il désigne un phénomène fascinant : celui de groupes d’organismes – espèces, genres ou familles – qui semblent avoir disparu pendant des millions d’années si l’on se fie à l’ensemble des fossiles découverts à ce jour, avant de réapparaître comme par miracle.

Le concept a été introduit dans les années 1980 par les scientifiques états-uniens Karl Flessa et David Jablonski, puis affiné par la suite. Toutefois, les scientifiques ne sont pas toujours d’accord sur la manière de le définir : certains, comme Jablonski, y voient une simple absence temporaire dans les archives fossiles pendant un intervalle de temps donné, d’autres le réservent aux retours spectaculaires après les grandes crises d’extinction massive.

Pourquoi ces « résurrections » apparentes ?

L’effet Lazare demeure de fait étroitement lié à la qualité du registre fossile, c’est-à-dire à l’ensemble des fossiles découverts à ce jour, qui n’offre qu’une image partielle du passé de la vie. La fossilisation est un processus rare et sélectif : certains organismes se fossilisent mieux (par exemple, ceux dotés de coquilles ou d’os) et certains milieux (comme les fonds marins) favorisent la conservation des restes biologiques. De plus, les roches peuvent être détruites, transformées ou tout simplement jamais explorées. Résultat : de larges pans de l’histoire du vivant nous échappent encore.

L’absence d’un taxon (unité de genre, de famille ou d’espèce) dans le registre fossile pendant des millions d’années peut donc avoir deux explications :

  • une cause « stratigraphique », autrement dit un trou dans les archives. Le taxon a bien survécu, mais nous n’en avons conservé aucune trace ;

  • une cause « biologique » signifiant qu’il s’agit d’un véritable événement évolutif.

Plusieurs scénarios peuvent alors expliquer cette disparition apparente :

→ Le taxon a pu trouver refuge dans des zones isolées, de petite taille ou mal explorées. Après une longue période d’isolement dans ces refuges, le taxon a ensuite envahi de nouveau son territoire originel et est réapparu dans le registre fossile.

→ Il a pu subsister à très faible densité, en dessous du seuil nécessaire pour laisser des traces fossiles. En dessous de ce seuil, la population reste viable, mais nous n’avons tout simplement aucune trace de son existence. Malheureusement, ce seuil varie selon les environnements et les taxons, et il est quasiment impossible à quantifier.

La distinction entre les alternatives stratigraphique et biologique est souvent difficile. L’intensité des fouilles, la qualité de l’identification des fossiles et le niveau taxonomique (espèce, genre, famille…) jouent tous un rôle crucial dans l’interprétation de ces cas. Il faut aussi noter que l’interprétation de l’effet Lazare est une procédure asymétrique, car l’alternative biologique n’est privilégiée que lorsque l’alternative stratigraphique ne peut être documentée. Par conséquent, les techniques analytiques évaluant l’exhaustivité des archives fossiles sont essentielles pour comprendre la signification des taxons Lazare.

Origines de l’effet Lazare mettant en évidence les alternatives stratigraphique et biologique qui soit empêchent la préservation, soit limitent le nombre de restes préservés encore non découverts en raison d’un échec d’échantillonnage. Adapté de Fara (2001).
Fourni par l’auteur

Quand la vie joue à cache-cache : quelques exemples

Une chose reste elle certaine, les exemples de taxons Lazare sont bien moins rares qu’on pourrait le penser.

Les lézards iguanidés, par exemple, étaient très répandus et diversifiés en Europe durant l’Éocène (de -56 millions à -33,9 millions d’années). On pensait qu’ils avaient totalement disparu du continent après la transition Éocène-Oligocène. Pourtant, la découverte, en 2012, de spécimens du genre Geiseltaliellus dans le sud de la France a montré qu’ils avaient survécu quelque temps en faible abondance avant de s’éteindre définitivement, probablement à la fin de l’Oligocène, il y a 23 millions d’années.

Autre cas remarquable : le gastéropode du genre Calyptraphorus. Longtemps considéré comme disparu à la fin de l’Éocène, il a refait surface au Pliocène (de -5,3 millions à -2,6 millions d’années) dans des gisements des Philippines (Asie du Sud-Est), prolongeant son existence fossile d’environ 30 millions d’années ! Cette longévité cachée suggère qu’il aurait survécu discrètement dans des zones refuges du Pacifique tropical.

La redécouverte d’espèces vivantes appartenant à des groupes que l’on pensait éteints constitue une expression rare et spectaculaire de l’effet Lazare. Parmi les exemples les plus emblématiques on peut par exemple citer, le cœlacanthe, véritable icône de l’effet Lazare. Ce poisson, que l’on croyait éteint depuis 66 millions d’années, a été redécouvert vivant en 1938 au large de l’Afrique du Sud (Afrique australe).

Un autre cas remarquable est celui de Laonastes, un petit rongeur découvert en 2005 au Laos, en Asie du Sud-Est, sur les étals d’un marché local de viande sauvage. Au départ, les chercheurs pensaient avoir affaire à une nouvelle famille de rongeurs, qu’ils ont appelée Laonastidæ.

Le kanyou (Laonastes aenigmamus) est un rongeur découvert au Laos dans la province de Khammouane. Décrit en 2005 il est le seul représentant vivant de la famille de Diatomyidæ ; famille que l’on pensait disparue depuis plus de 11 millions d’années
Le kanyou ou khan-you (Laonastes aenigmamus) est un rongeur découvert au Laos, dans la province de Khammouane. Décrit en 2005, il est le seul représentant vivant de la famille des Diatomyidæ ; famille que l’on pensait disparue depuis plus de 11 millions d’années.
Jean-Pierre Hugot, CC BY

Cette classification reposait sur des analyses génétiques basées sur un nombre limité de gènes et sur la comparaison de sa morphologie avec celle d’espèces actuelles. Mais un véritable bouleversement scientifique est survenu lorsque les scientifiques ont intégré des fossiles dans leurs analyses morphologiques. En comparant en détail le crâne, la mandibule, les dents et le squelette de Laonastes avec des rongeurs fossiles et actuels, ils ont découvert qu’il appartenait en réalité à la famille des Diatomyidæ, que l’on croyait éteinte depuis plus de 11 millions d’années.

Ces analyses ont également révélé que les plus proches parents actuels de cette famille sont les goundis Ctenodactylus gundi. Des études génétiques plus poussées sur les espèces actuelles ont ensuite confirmé ce lien de parenté entre Laonastes et les goundis, et révélé que ces deux lignées auraient divergé il y a environ 44 millions d’années. Laonastes représente donc un exemple frappant de taxon Lazare.

Pourquoi ces découvertes sont-elles si importantes ?

Les taxons Lazare sont ainsi bien plus que des curiosités de la nature. Ils offrent aux scientifiques des clés uniques pour comprendre l’évolution du vivant, la résilience des espèces face aux crises et surtout les limites du registre fossile.

En phylogénie, leur réapparition peut modifier notre compréhension des liens de parenté entre les espèces, des dates de divergence et d’extinction ou encore de la vitesse d’évolution morphologique.

En paléontologie, ils rappellent à quel point le registre fossile est biaisé et incomplet, et combien il faut être prudent avant de déclarer une espèce « disparue ».

Enfin, les taxons Lazare montrent que la vie ne disparaît pas toujours là où on le croit. Parfois, elle se retire simplement dans l’ombre pour ressurgir des millions d’années plus tard, comme un témoin silencieux de la longue histoire de l’évolution.

Parce que dans les usages de nomenclature biologique, seuls les noms de rangs générique et infra-générique (genre, espèce, sous-espèce) se composent en italique, tandis que les noms de familles et au-dessus (famille, sous-famille, ordre, etc.) se composent en romain. Ainsi, Laonastidæ a parfois été perçu comme un nom de genre par confusion et mis en italique à tort, alors que Diatomyidæ est un nom de famille correctement laissé en romain.

The Conversation

Violaine Nicolas Colin a reçu des financements de l’ANR.

ref. L’« effet Lazare », ou quand certains êtres vivants ressurgissent après des millions d’années – https://theconversation.com/l-effet-lazare-ou-quand-certains-etres-vivants-ressurgissent-apres-des-millions-dannees-269236

Le bonheur s’achète-t-il en solde ?

Source: The Conversation – France (in French) – By Mickaël Mangot, Docteur en économie, spécialiste d’économie comportementale et d’économie du bonheur, conférencier, chargé de cours, ESSEC

Les difficultés de la vie quotidienne peuvent modérer le bénéfice de la consommation sur notre bonheur. Pack-Shot/Shutterstock

Consommer nous rend-il plus heureux ? Les soldes nous rapprochent du bonheur ou, au contraire, nous en éloigne-t-il ? Selon l’économie du bonheur, toutes les consommations ne se valent pas…

Depuis le début des années 1970, l’économie du bonheur constitue un courant de recherche, au sein de la science économique, qui se propose de décrypter comment les comportements des individus influencent leur niveau de bonheur.

Si la relation entre revenus et bonheur a beaucoup occupé la discipline, de plus en plus de chercheurs s’intéressent désormais à la relation entre consommation et bonheur, sur un plan quantitatif – combien on consomme – comme qualitatif – ce que l’on consomme.

Est-on d’autant plus heureux que l’on consomme ? À l’instar de la relation entre revenus et bonheur, la réponse est clairement affirmative, que ce soit en Europe, aux États-Unis ou en Asie. Mais, comme pour le revenu, la consommation explique à elle seule très peu des différences de bonheur entre individus, entre 5 % et 15 %. Il existe beaucoup de personnes qui sont heureuses tout en consommant peu et, inversement, des individus très dépensiers qui sont insatisfaits de leur vie.

Impact éphémère

Cette absence de relation forte entre niveau de consommation et niveau de bonheur s’explique en grande partie par plusieurs mécanismes psychologiques.

Hormis quelques exceptions – chômage, handicap lourd, maladies chroniques ou dégénératives, etc., les humains s’adaptent aux chocs de vie, positifs ou négatifs.

La consommation, notamment de biens matériels, fait partie de ces événements qui ne laissent plus aucune de trace sur le bonheur à moyen long terme. Une fois l’achat effectué, nos consommations sont vite reléguées à l’arrière-plan de nos vies. Cette règle s’applique autant pour les petits achats – vêtements, déco ou high-tech – que pour les biens durables très onéreux comme la voiture ou le logement.

Les désirs se renouvellent et progressent constamment. Plus le niveau de vie augmente, plus les aspirations s’élèvent.

Cette montée en gamme (ou lifestyle inflation) s’applique à tout : logement, voiture, vêtements, restaurants, loisirs… À 20 ans on rêve d’un McDo et d’une chambre de bonne et à 60 ans d’un restaurant étoilé et d’une maison de maître. Dans nos armoires ou sur nos étagères, les consommations passées sont les vestiges visibles de désirs aujourd’hui dépassés.

Compétition sociale

S’ajoute aussi le mécanisme de la comparaison sociale : on fait l’expérience de son niveau de vie en partie cognitivement, en l’évaluant par rapport à celui des autres. Un niveau de vie élevé n’est pas gage de satisfaction s’il traduit un statut inférieur à celui de ses collègues, de ses voisins et de sa famille.

Ce n’est donc pas seulement notre propre consommation qui est importante pour le bonheur (positivement), mais également celle de notre entourage immédiat (négativement), du moins pour les consommations facilement observables – logement, voiture, vêtements, montres…

La satisfaction de la vie au sein d’un ménage augmente en fonction du rang de ce ménage en termes de consommation observable au sein de la même localité. D’ailleurs, lorsqu’un ménage gagne à la loterie, cela tend à augmenter les consommations observables des ménages dans ses alentours.


À lire aussi :
Soldes : les commerçants sont-ils d’honnêtes manipulateurs ?


L’observation de biens de luxe chez les autres peut être particulièrement nocive pour le bonheur. Une étude a obtenu que plus la proportion de Porsche et de Ferrari est élevée dans une ville ou une région, et plus le niveau de bonheur moyen y était faible.

Privilégier les expériences

De nombreux travaux ont cherché à distinguer différents types de consommation selon leur intensité et selon la durabilité de leur impact sur le bonheur. Ils ont fait émerger une liste de consommations plus propices au bonheur :

Ces consommations ont la particularité de renforcer la connexion aux autres, d’améliorer l’image sociale ou l’image de soi, ou de contribuer à forger une identité.

Il est à noter que la liste n’est pas exactement la même pour tout le monde. Elle est modérée par les valeurs, la personnalité et les difficultés propres à la personne. Les biens matériels influencent plus le bonheur des personnes ayant des revenus modestes ou des valeurs matérialistes. Les valeurs matérialistes expliquent que la possession d’une voiture et sa valeur marchande sont particulièrement impactantes pour le bonheur des… boomers.

Plus la consommation est alignée avec la personnalité, et plus elle a généralement d’effet. Par exemple, les extravertis bénéficient plus que les introvertis des consommations sociales comme les sorties dans les bars et restaurants, et inversement pour les achats de livres.

Pallier les difficultés

Les difficultés du quotidien modèrent l’effet de la consommation sur le bonheur. La voiture est particulièrement importante pour le bonheur chez les personnes qui ont des problèmes de mobilité du fait d’une santé défaillante ou de l’absence d’alternatives. De même, le recours à des services pour gagner du temps est particulièrement efficace pour doper le bonheur des personnes qui en manquent (comme les parents en activité).

Ces dernières observations sont à relier à un autre mécanisme psychologique fondamental : le biais de négativité. Les émotions négatives affectent plus fortement et plus durablement l’évaluation de la vie que les émotions positives. On s’adapte en général moins rapidement aux chocs de vie négatifs qu’aux chocs positifs.

Les domaines de la vie pour lesquels on est insatisfait influencent plus l’évaluation générale de la vie que les domaines apportant satisfaction. Les consommations ont généralement plus d’effet sur le bonheur quand elles permettent de corriger un manque, plutôt que lorsqu’elles ajoutent du positif.

Plaisir de la transaction

Ces découvertes sont, pour certaines, plutôt intuitives. Néanmoins, les consommateurs peinent à en tirer les leçons pratiques du fait d’erreurs systématiques au moment des décisions. Par exemple, ils tendent à sous-estimer la puissance de l’adaptation aux évènements de la vie, notamment positifs, tout comme ils sous-estiment leurs changements de goûts et de priorités dans le temps.

Lors d’un achat, la quête du bonheur entre souvent en conflit avec la recherche d’une rationalité économique. La satisfaction attendue de la consommation est mise en balance avec le plaisir de la transaction, comme l’a montré le Prix Nobel d’économie Richard Thaler. En période de promotions, on se laisse aller à acheter des produits dont on n’a ni besoin ni réellement envie uniquement pour faire une bonne affaire. Le plaisir de la transaction est éphémère ; après coup on oublie vite avec quel niveau de remise l’achat a été réalisé.

Finalement, essayons de renverser la question : être vraiment heureux changerait-il notre façon de consommer ? Quelques études pionnières suggèrent que les personnes heureuses consomment différemment des autres : elles consomment moins (et épargnent plus) tout en ayant une consommation davantage orientée vers les sorties que vers les biens matériels. Ces études ne disent pas, en revanche, si ces personnes déjà très heureuses vont jusqu’à ignorer le Black Friday…

The Conversation

Mickaël Mangot ne travaille pas, ne conseille pas, ne possède pas de parts, ne reçoit pas de fonds d’une organisation qui pourrait tirer profit de cet article, et n’a déclaré aucune autre affiliation que son organisme de recherche.

ref. Le bonheur s’achète-t-il en solde ? – https://theconversation.com/le-bonheur-sachete-t-il-en-solde-270576

Sumatra’s flood crisis: How deforestation turned a cyclonic storm into a likely recurring tragedy

Source: The Conversation – Indonesia – By Dian Fiantis, Professor of Soil Science, Universitas Andalas

Cyclone Senyar hit South and Southeast Asian countries in late November. In Indonesia, the island of Sumatra, especially its northern parts, took the worst hit.

The storm set off flash floods and landslides that tore through towns, killed hundreds of people, and pushed thousands of families out of their homes. Many houses were submerged to their rooftops or swept away entirely, while rivers turned into sudden, violent torrents.

But this wasn’t just a natural disaster brought on by intense rain. Weather was only part of the story. The real damage occured when extreme rainfall collided with an already weakened ecosystem.

The result was a deadly catastrophe.

When forests are cleared and the land is degraded, the ecosystem loses its natural ability to act as a “sponge.” Rainwater that once slowly seeped into the forest floor now rushes over the land, turning into torrential runoff that crashes into people’s homes.

This is why the recent floods in Sumatra must be understood not only as a hydrometeorological phenomenon, but as a sign of ecosystem collapse: the soil–forest–water cycle is degrading, exacerbated by decades of deforestation and land-use change.

Healthy soil: A silent water absorber

Healthy soil works like a sponge. It is rich in organic matter and full of pores and channels created by roots and soil organisms. Well-maintained soil can absorb remarkably large volumes of water.

A forest is not only a collection of trees. It is a hydrological system whose functions extend from underground to the atmosphere. Plant roots create pathways for water to seep into the soil, the canopy slows the fall of rain, and leaf litter protects the surface from erosion. Trees absorb water from the soil and release it through transpiration, helping regulate humidity and rainfall patterns.

When forests are cleared for plantations, mining, or agricultural expansion, the soil’s capacity to absorb water collapses. The roots that once bound the soil decay. The soil loses its protection. Leaf litter disappears. Organic matter declines, the soil becomes compacted, eroded, and damaged.

As a result, the landscape loses its ability to absorb water, runoff increases, and slopes in hilly and mountainous regions become unstable. Meanwhile, rivers receive large amounts of water in a short time. When they cannot contain it, they overflow, triggering deadly floods.


Baca juga:
Death and devastation: why a rare equatorial cyclone and other storms have hit southern Asia so hard


The case of Sumatra

In North Sumatra, the Batang Toru, a major river in the Tapanuli Selatan highlands, flows through one of the most biodiverse mountain ranges.

Its watershed provides water for irrigation, household use, fisheries, and micro-hydropower.

The surrounding tropical rainforest is the last primary forest block in this region, serving as home for a huge biodoversity and acting as a natural buffer against floods and landslides.

But this resilience is rapidly disappearing. The northern zone of Batang Toru, at 300–400 metres elevation, has been opened up for mining since 2010. Forest clearing for oil palm plantations continued until 2024.

Our latest satellite analysis shows that approximately 1,550 hectares of the forests in the area have lost their vegetation cover, leaving bare soil highly susceptible to erosion in the Batang Toru watershed.

Degraded slopes like these can no longer absorb rainfall or stabilise the watershed. Communities downstream become increasingly vulnerable when extreme storms hit.

In West Sumatra, a week earlier, relentless rainfall soaked Padang City. Rainfall intensity rose sharply: daily totals increased from 37 mm on 19 November to 145 mm on 27 November 2025, with total accumulation exceeding 770 mm. The soil finally gave way, unable to hold any more water in its pore network.

An estimated 152 hectares of forest have been lost in the upstream areas of the Batang Kuranji and Batang Aie Dingin rivers in Padang City. As a result, the entire water cycle has been disrupted. Groundwater recharge declined, surface runoff increased, and rivers turned “ferocious,” with surging discharge volumes that triggered flooding.

When rain falls, the water is clear. But during floods, it turns brownish-yellow or even black — a sign that eroded soil has been carried away by the flow.

Four days after the flash floods, the Batang Kuranji (19.68 km) and Batang Aie Dingin (14.27 km) rivers in Padang remained brownish-yellow, flowing rapidly towards Padang Beach.

Communities suffer the consequences, while coastal ecosystems become increasingly choked by sediment.

The four rivers in Padang originate in the Bukit Barisan Mountains, where their exposed soil surfaces easily wash away during heavy rain.

Ecosystem-based disaster adaptation

We often see deforestation and soil degradation as local issues. But the scale of the impacts shows that these problems carry national consequences.

As extreme rainfall becomes more frequent, every damaged watershed becomes a risk multiplier.

In areas with healthy soils and intact forests, storms can still cause damage, but the ecosystem absorbs part of the impact. In critically degraded areas, the same storm can escalate into a major disaster.

Taking the lesson from Sumatra, this shows that a climate resilience strategy cannot rely solely on levees, dams, or emergency responses. We must rebuild the ecological infrastructure that regulates water flow.

Maintaining the soil–forest–water relationship is essential for our safety — now and in the future.

Thus, we must protect remaining forests, especially headwater catchments and peatlands; restore degraded soils by increasing organic matter, expanding agroforestry, and promoting sustainable farming practices; and include soil-health and land-cover indicators in flood-risk planning.

Ecosystem-based adaptation, from reforestation to planting vegetation along riverbanks, must go hand in hand with engineered solutions.

If we only react to disasters without restoring the ecological buffers that prevent them, future floods will be even bigger and more deadly.

Extreme weather will always come. But we can reduce the impacts by restoring forests and improving the condition of the soils beneath our feet so that the next storm does not have to become the next tragedy.

The Conversation

Para penulis tidak bekerja, menjadi konsultan, memiliki saham atau menerima dana dari perusahaan atau organisasi mana pun yang akan mengambil untung dari artikel ini, dan telah mengungkapkan bahwa ia tidak memiliki afiliasi di luar afiliasi akademis yang telah disebut di atas.

ref. Sumatra’s flood crisis: How deforestation turned a cyclonic storm into a likely recurring tragedy – https://theconversation.com/sumatras-flood-crisis-how-deforestation-turned-a-cyclonic-storm-into-a-likely-recurring-tragedy-271302

Becoming human in southern Africa: what ancient hunter-gatherer genomes reveal

Source: The Conversation – Africa (2) – By Marlize Lombard, Professor with Research Focus in Stone Age Archaeology, Palaeo-Research Institute, University of Johannesburg

New genetic research is shedding light on some of the earliest chapters of our human history. In one of the largest studies of its kind, scientists analysed DNA from 28 individuals who lived in southern Africa between 10,200 and a few hundred years ago. The study provides more evidence that hunter-gatherers from southern Africa were some of the earliest modern human groups, with a genetic ancestry tracing back to about 300,000 years ago. Marlize Lombard, an archaeologist whose research focuses on the development of the human mind, breaks down the key findings.

Why did you study the DNA of ancient hunter-gatherers in southern Africa?

According to the genetic, palaeo-anthropological and archaeological evidence, modern humans – Homo sapiens – originated in Africa hundreds of thousands of years ago and then spread around the world. But the evolutionary process of exactly how, where and when this happened is debated.

Africa has the greatest human genetic diversity and the hunter-gatherers of southern Africa represent some of the oldest known genetic lineages. They can therefore reveal more about where and when we originated as a species.

After thousands of years of migration, modern African populations have a mixed genetic heritage. So their genomes are not very helpful for understanding our deep evolutionary history. For that, we need to look at genetic variation among individuals living before large-scale population movements on the continent.

In southern Africa, it means going back to before about 1,400-2,000 years ago. It also means that such rare ancient hunter-gatherer DNA can provide valuable information, not available in the DNA of living people.

What we specifically wanted to learn from the ancient southern African DNA was to which extent the biological and behavioural patterns we observe in the fossil and archaeological records were continuous and particular to the region.

For example, at a South African fossil-bearing site called Florisbad, we have a human skull dating to about 260,000 years ago that shows a possible transition from Homo heidelbergensis into Homo sapiens. And from about 100,000 years ago there was a rapid increase in technological innovations such as paint-making, glue-making and long-range weapon use.

We sequenced the DNA of 28 ancient individuals from what is now South Africa, all dating to the Holocene epoch that started about 11,700 years ago. DNA sequencing “reads” the order of the chemical base-pairs that make up an individual’s DNA. This helps us to reconstruct a person’s genome, or their complete set of genetic information. Among other things, it can tell us something about the individual’s biological and behavioural characteristics.

Eight of the individuals used to live near the coast at Matjes River, in today’s Western Cape province. Several others lived at inland sites across South Africa. We dated their remains with radiocarbon dating, finding that the oldest died about 10,200 years ago at Matjes River and the most recent died just 280 years ago in the Free State. (All DNA from archaeological contexts is scientifically known as ancient DNA.)

What did the DNA reveal?

Our study shows that the genetic makeup of the southern African hunter-gatherer population didn’t change much for 9,000 years across the whole of South Africa, not only in the southern Cape, even though their technologies and lifeways may have changed or differed during this time.

All ancient southern Africans dated to more than 1,400 years ago had some unique Homo sapiens genetic variations. The ancient DNA had genes associated with UV-light protection, skin diseases, and skin pigmentation. These could have been essential to life on southern Africa’s grasslands and fynbos. Among the genetic variants that were common to ancient and modern humans were genes related to kidney function (potentially connected to improved water-retention) and immune-system related genes.

About 40% of the ancient southern African genes are associated with neurons, brain growth and the way that human brains process information today. Some of these gene variants may have been involved in the evolution of how humans pay attention today. Attention is a cognitive or mental trait that seems to have evolved differently in African Homo sapiens compared to the now extinct Neanderthals and Denisovans from Eurasia. It may have played a role in the successful spread of Homo sapiens out of Africa after about 60,000 years ago.

What does this tell us about human evolution and population migration?

Our work shows that some biological adaptations for becoming modern humans were unique to southern African hunter-gatherers who lived in a relatively large, stable population for many thousands of years south of the Limpopo River.

Co-author and geneticist from Uppsala University in Sweden, Carina Schlebusch, commented that

Because we now have more unadmixed ancient genomes from southern Africa, we are gaining better population-level insights, and a much clearer foundation for understanding how modern humans evolved across Africa.

Our findings contrast with linguistic, archaeological and some early genetic studies pointing to a shared ancestry or long-term interaction between different regions of Africa. Instead, it seems that southern Africa may have offered humans a climate and landscape refuge where hunter-gatherers thrived, adapting to a place rich in plant and animal resources for 200,000 years or more. During this time, we see no genetic evidence for incoming populations. Instead, sometime after about 100,000-70,000 years ago, small groups of southern African hunter-gatherers may have wandered northwards, carrying with them some of their genetic and technological characteristics.

According to population geneticist Mattias Jakobsson at Uppsala University,

these ancient genomes tell us that southern Africa played a key role in the human journey, perhaps ‘the’ key role.

Up to now, humans seemed to have developed their modern anatomical (physical) form before they developed modern behaviour and thinking. Learning more about ancient genes could help to close this gap, especially once more becomes known from genetic studies of other ancient African forager groups, and indigenous peoples elsewhere on the globe.

The Conversation

Marlize Lombard works for the University of Johannesburg. She received funding from the National Research Foundation of South Africa.

ref. Becoming human in southern Africa: what ancient hunter-gatherer genomes reveal – https://theconversation.com/becoming-human-in-southern-africa-what-ancient-hunter-gatherer-genomes-reveal-270378

Governments need to prepare for more frequent large floods

Source: The Conversation – Canada – By Samadhee Kaluarachchi, PhD Student in Forest Hydrology, University of British Columbia

Flood management is a priority for many governments around the world. Recent floods have led to hundreds of deaths and caused significant damage in Indonesia, Sri Lanka, Thailand, Vietnam, Albania, Kenya and elsewhere.

Canada too is no stranger to floods. Notably, in 2021, flooding in British Columbia cut off access to Metro Vancouver from the rest of the country and caused up to $14 billion in damages.

While many scientific and technical reports show that floods are becoming larger and more common, these reports may be underestimating how their frequency is changing. Flood sizes get the spotlight, however governments and experts need to also consider their frequency to address implications overlooked by traditional management methods.

Frequency and size together must tell the story, because even modest increases in size can lead to surprisingly big jumps in frequency. For example, timber harvesting in the B.C. Interior has led to a 19 to 26 per cent increase in flood size, and turned the former 100-year flood into a once-a-decade flood. Despite floods becoming more frequent, today’s practices still dominantly focus on flood size.

The consequences are severe. We can build infrastructure like dikes and dams bigger so they withstand larger once-in-a-century floods. But if we don’t capture how floods of all sizes (including the 100- and 200-year events) are becoming way more common, infrastructure can weaken and fail faster than we expect.

In our recently published study, we examined a range of scientific, technical and governmental documents to assess whether practices today help us reliably predict flood risks. We found that many of the factors contributing to the severity of a flood could respond much more strongly to climate and landscape changes than traditional methods imply, calling for change in our flood prediction practices.

We’re underestimating flood risk

tractors and diggers clear debris following a flood
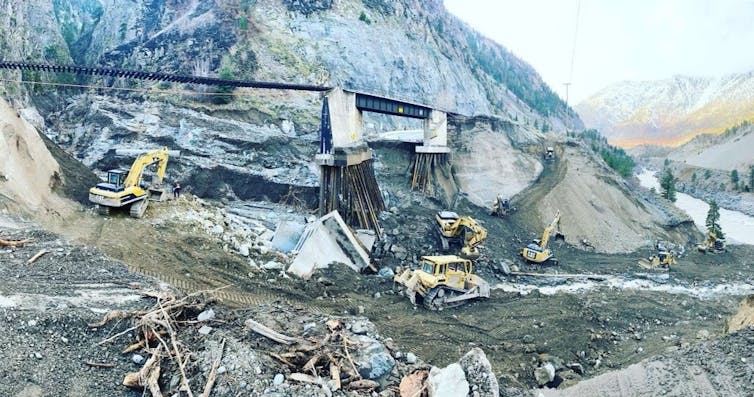
Restoration work underway following November 2021 flooding damage at Tank Hill on Highway 1 in B.C.
(B.C. Ministry of Transportation and Transit/flickr), CC BY-NC-ND

Nature’s flood “ingredients” include rainfall, snow, soil wetness and energy for snowmelt, which combine in many “recipes” to trigger floods. Human influences like climate change, land use and land cover changes can alter these recipes, making floods bigger and more common. Understanding how human activity causes these effects on floods means predicting flood frequency and size together.

However, short flood records make it difficult to estimate the frequency and size of large floods. Without overcoming this challenge, assessments can produce unreliable results.

Additionally, many studies lump distant flood records with more recent records, suggesting that floods today have similar odds as those decades ago. Yet, experts agree that changes in the climate and landscape alter floods more strongly today.

These practices together produced a widespread perception in risk assessments where flood sizes rise rapidly, or steeply, per change in frequency (called a “heavier tail”).

Our recently published study challenges that perception, which implies that human influence shouldn’t greatly alter floods. In many places, human activities are making large floods more common. By giving little attention to how our activities affect flood frequencies, our practices don’t seem to capture just how sensitive floods are and how much they’re changing.

Without adapting our practices, we risk the loss of lives and livelihoods, misallocating funds, economic losses and lawsuits against governments, municipalities and professionals. Reliable flood projection and management is vital.

Considering flood frequency

To make reliable flood projections, we first need to identify a region’s natural flood frequencies and sizes, and which climate and landscape features drive them. With this solid baseline, we can determine how human activities shift flood frequencies and sizes, if floods are sensitive to human influence and what this means for society.

We can do this by predicting how different human activities affect floods through modelling or landscape experiments. We can work with flood records, using methods that recognize how current and future floods are far more affected by human activities than past floods.

We can use existing techniques to overcome challenges with short records and ensure that our estimates reflect a strong understanding of the natural and human drivers of flood frequencies and sizes.

By adopting stronger practices, our study predicts that many regions could see very different frequency-size relations: flood sizes could increase more slowly per change in frequency.

It signals a more “fragile,” or super sensitive, flood regime than what current methods imply. When we disturb the climate or landscape, large floods can react strongly; they become much more common, reflecting what we see in many places today.

This knowledge can help governments effectively manage the land while mitigating major jumps in flood frequency.

The way forward

Muddy floodwaters submerge a highway
Floodwaters wash away part of Highway 8 in B.C. in November 2021.
(B.C. Ministry of Transportation and Transit/flickr), CC BY-NC-ND

Effective flood management must include strong policies, nature-based solutions, and infrastructure designed for size and strength to withstand both larger and more frequent floods.

Nature-based solutions such as green areas, permeable surfaces and water-retaining features are being adopted by governments worldwide. Studies suggest that measures like increased forest cover have little impact on large floods; however, this may reflect the focus on flood size. Natural landscapes like forests can greatly reduce flood frequencies, even for very large floods.

In B.C., landscape features like mountains, forests, lakes, wetlands and floodplains spread out floods, lowering their peaks and making large events rarer. However, these same features make floods react strongly to changes in the climate and landscape.

Flood risk management must work with nature, maintaining or increasing the landscapes’ ability to store floodwaters. Our policies must address flood risk at the source through effective land management, recognizing that key causes of urban floods could lie thousands of kilometres away in the distant uplands. With strong policies and interventions both upstream and downstream, we can proactively manage floods.

The Conversation

Samadhee Kaluarachchi receives funding from the Natural Sciences and Engineering Research Council of Canada, the Faculty of Forestry at the University of British Columbia, the Gordon and Nora Bailey Fellowship in Sustainable Forestry, and the Mary and David Macaree Fellowship.

Younes Alila receives funding from Mitacs Canada and the Natural Sciences and Engineering Research Council of Canada.

ref. Governments need to prepare for more frequent large floods – https://theconversation.com/governments-need-to-prepare-for-more-frequent-large-floods-269251

FDA claims on COVID-19 vaccine safety are unsupported by reliable data – and could severely hinder vaccine access

Source: The Conversation – USA (3) – By Frank Han, Assistant Professor of Pediatric Cardiology, University of Illinois Chicago

The FDA has provided no evidence that children died because of receiving a COVID-19 vaccine. Anchiy/E+ via Getty Images

The Food and Drug Administration is seeking to drastically change procedures for testing vaccine safety and approving vaccines, based on unproven claims that mRNA-based COVID-19 vaccines caused the death of at least 10 children.

The agency detailed its plans in a memo released to staff on Nov. 28, 2025, which was obtained by several news outlets and published by The Washington Post.

Citing an internal, unpublished review, the memo, written by the agency’s top vaccine regulator, Vinay Prasad, attributes the children’s deaths to myocarditis, an inflammation of the heart muscle. And it says the deaths were reported to the Vaccine Adverse Event Reporting System, or VAERS, but provides no evidence that the vaccines caused the deaths.

The death of children due to an unsafe vaccine is a serious allegation. I am a pediatric cardiologist who has studied the link between COVID-19 vaccines and heart-related side effects such as myocarditis in children. To my knowledge, studies to date have shown such side effects are rare, and severe outcomes even more so. However, I am open to new evidence that could change my mind.

But without sufficient justification and solid evidence, restricting access to an approved vaccine and changing well-established procedures for testing vaccines would carry serious consequences. These moves would limit access for patients, create roadblocks for companies and worsen distrust in vaccines and public health.

In my view, it’s important for people reading about these FDA actions to understand how the evidence on a vaccine’s safety is generally assessed.

Determining cause of death

The FDA memo claims that the deaths of these children were directly related to receiving a COVID-19 immunization.

From my perspective as a clinician, it is awful that any child should die from a routine vaccination.

However, health professionals like me owe it to the public to uphold the highest possible standards in investigating why these deaths occurred. If the FDA has evidence demonstrating something that national health agencies worldwide have missed – widespread child deaths due to myocarditis caused by the COVID-19 vaccine – I don’t doubt that even the most pro-vaccine physician will listen. So far, however, no such evidence has been presented.

While a death logged in VAERS is a starting point, on its own it is insufficient to conclude whether a vaccine caused the death or other medical causes were to blame.

To demonstrate a causal link, FDA staff and physicians must align the VAERS report with physicians’ assessments of the patient, as well as data from other sources for monitoring vaccine safety. These include PRISM, which logs insurance claims data, and the Vaccine Safety Datalink, which tracks safety signals in electronic medical records.

It’s known that most deaths logged only in VAERS of children who recently received vaccines have been incorrectly attributed to the vaccines – either by accident or in some cases on purpose by anti-vaccine activists.

Heart-related side effects of COVID-19 vaccines

In his Substack and Twitter accounts, Prasad has said that he believes the rate of severe cardiac side effects after COVID-19 vaccination is severely underestimated and that the vaccines should be restricted far more than they currently are.

In a July 2025 presentation, Prasad quoted a risk of 27 cases per million of myocarditis in young men who received the COVID-19 vaccine. A 2024 review suggested that number was a bit lower – about 20 cases out of 1 million people. But that same study found that unvaccinated people had greater risk of heart problems after a COVID-19 infection than vaccinated people. In a different study, people who got myocarditis after a COVID-19 vaccination developed fewer complications than people who got myocarditis after a COVID-19 infection.

Existing vaccine safety infrastructure in the U.S. successfully identifies dangers posed by vaccines – and did so during the COVID-19 pandemic. Today, most COVID-19 vaccines in the U.S. rely on mRNA technology. But as vaccines were first emerging during the COVID-19 pandemic, two pharmaceutical companies, Janssen and AstraZeneca, rolled out a vaccine that used a different technology, called a viral vector. This type of vaccine had a very rare but genuine safety problem that was detected.

A report in VAERS is at most a first step to determining whether a vaccine caused harm.

VAERS, the Vaccine Safety Datalink, clinical investigators in the U.S. and their European counterparts detected that these vaccines did turn out to cause blood clotting. In April 2021, the FDA formally recommended pausing their use, and they were later pulled from the market.

Death due to myocarditis from COVID-19 vaccination is exceedingly rare. Demonstrating that it occurred requires proof that the person had myocarditis, evidence that no other reasonable cause of death was present, and the absence of any additional cause of myocarditis. These factors cannot be determined from VAERS data, however – and to date, the FDA has presented no other relevant data.

A problematic vision for future vaccine approvals

Currently, vaccines are tested both by seeing how well they prevent disease and by how well they generate antibodies, which are the molecules that help your body fight viruses and bacteria.

Some vaccines, such as the COVID-19 vaccine and the influenza vaccine, need to be updated based on new strains. The FDA generally approves these updates based on how well the new versions generate antibodies. Since the previous generation of vaccines was already shown to prevent infection, if the new version can generate antibodies like the previous one, researchers assume its ability to prevent infection is comparable too. Later studies can then test how well the vaccines prevent severe disease and hospitalization.

The FDA memo says this approach is insufficient and instead argues for replacing such studies with many more placebo-controlled trials – not just for COVID-19 vaccines but also for widely used influenza and pneumonia vaccines.

That may seem reasonable theoretically. In practice, however, it is not realistic.

Today’s influenza vaccines must be changed every season to reflect mutations to the virus. If the FDA were to require new placebo-controlled trials every year, the vaccine being tested would become obsolete by the time it is approved. This would be a massive waste of time and resources.

A pharmacy with a sign advertising flu shots
Influenza vaccines must be updated for every flu season.
Jacob Wackerhausen/iStock via Getty Images Plus

Also, detecting vaccine-related myocarditis at the low rate at which it occurs would have required clinical trials many times larger than the ones that were done to approve COVID-19 mRNA vaccines. This would have cost at least millions of dollars more, and the delay in rolling out vaccines would have also cost lives.

Placebo-controlled trials would require comparing people who receive the updated vaccine with people who remain unvaccinated. When an older version of the vaccine is already available, this means purposefully asking people to forgo that vaccine and risk infection for the sake of the trial, a practice that is widely considered unethical. Current scientific practice is that only a brand-new vaccine may be compared against placebo.

While suspected vaccine deaths should absolutely be investigated, stopping a vaccine for insufficient reasons can lead to a significant drop in public confidence. That’s why it’s essential to thoroughly and transparently investigate any claims that a vaccine causes harm.

Vaccine vs illness

To accurately gauge a vaccine’s risks, it is also crucial to compare its side effects with the effects of the illness it prevents.

For COVID-19, data consistently shows that the disease is clearly more dangerous. From Aug. 1, 2021, to July 31, 2022, more than 800 children in the U.S. died due to COVID-19, but very few deaths from COVID-19 vaccines in children have been been verified worldwide. What’s more, the disease causes many more heart-related side effects than the vaccine does.

Meanwhile, extensive evidence shows that COVID-19 vaccination reduces the risk of hospitalization by more than 70% and the risk of severe illness in adolescent children by 79%. Studies also show it dramatically reduces their risk of developing long COVID, a condition in which symptoms such as extreme fatigue or weakness persist more than three months after a COVID-19 infection.

Reporting only the vaccines’ risks, and not their benefits, shows just a small part of the picture.

The Conversation

I am a fellow of the American Academy of Pediatrics and regularly go on social media to share pro vaccine information.

ref. FDA claims on COVID-19 vaccine safety are unsupported by reliable data – and could severely hinder vaccine access – https://theconversation.com/fda-claims-on-covid-19-vaccine-safety-are-unsupported-by-reliable-data-and-could-severely-hinder-vaccine-access-271028