Source: The Conversation – USA – By Jun Wang, Professor of Chemical and Biochemical Engineering, University of Iowa

Canada is facing another dangerous wildfire season, with burning forests sending smoke plumes across the provinces and into the U.S. again. The pace of the 2025 fires is reminiscent of the record-breaking 2023 wildfire season, which exposed millions of people in North America to hazardous smoke levels.
For most of the past decade, forecasters have been able to use satellites to track these smoke plumes, but the view was only two-dimensional: The satellites couldn’t determine how close the smoke was to Earth’s surface.
The altitude of the smoke matters.
If a plume is high in the atmosphere, it won’t affect the air people breathe – it simply floats by, far overhead.
But when smoke plumes are close to the surface, people are breathing in wildfire chemicals and tiny particles. Those particles, known as PM2.5, can get deep into the lungs and exacerbate asthma and other respiratory and cardiac problems.
NOAA NESDIS Center for Satellite Applications and Research
The Environmental Protection Agency uses a network of ground-based air quality monitors to issue air quality alerts, but the monitors are few and far between, meaning forecasts have been broad estimates in much of the country.
Now, a new satellite-based method that I and colleagues at universities and federal agencies have been working on for the past two years is able to give scientists and air quality managers a 3D picture of the smoke plumes, providing detailed data of the risks down to the neighborhood level for urban and rural areas alike.
Building a nationwide smoke monitoring system
The new method uses data from a satellite that NASA launched in 2023 called the Tropospheric Emissions: Monitoring of Pollution, or TEMPO, satellite.

NOAA NESDIS Center for Satellite Applications and Research
TEMPO makes it possible to determine a smoke plume’s height by providing data on how much the oxygen molecules absorb sunlight at the 688 nanometer wavelength. Smoke plumes that are high in the atmosphere reflect more solar radiation at this wavelength back to space, while those lower in the atmosphere, where there is more oxygen to absorb the light, reflect less.
Understanding the physics allowed scientists to develop algorithms that use TEMPO’s data to infer the smoke plume’s altitude and map its 3D movement in nearly real time.

Adapted from Xu et al, 2019, CC BY
By combining TEMPO’s data with measurements of particles in the atmosphere, taken by the Advanced Baseline Imager on the NOAA’s GOES-R satellites, forecasters can better assess the health risk from smoke plumes in almost real time, provided clouds aren’t in the way.
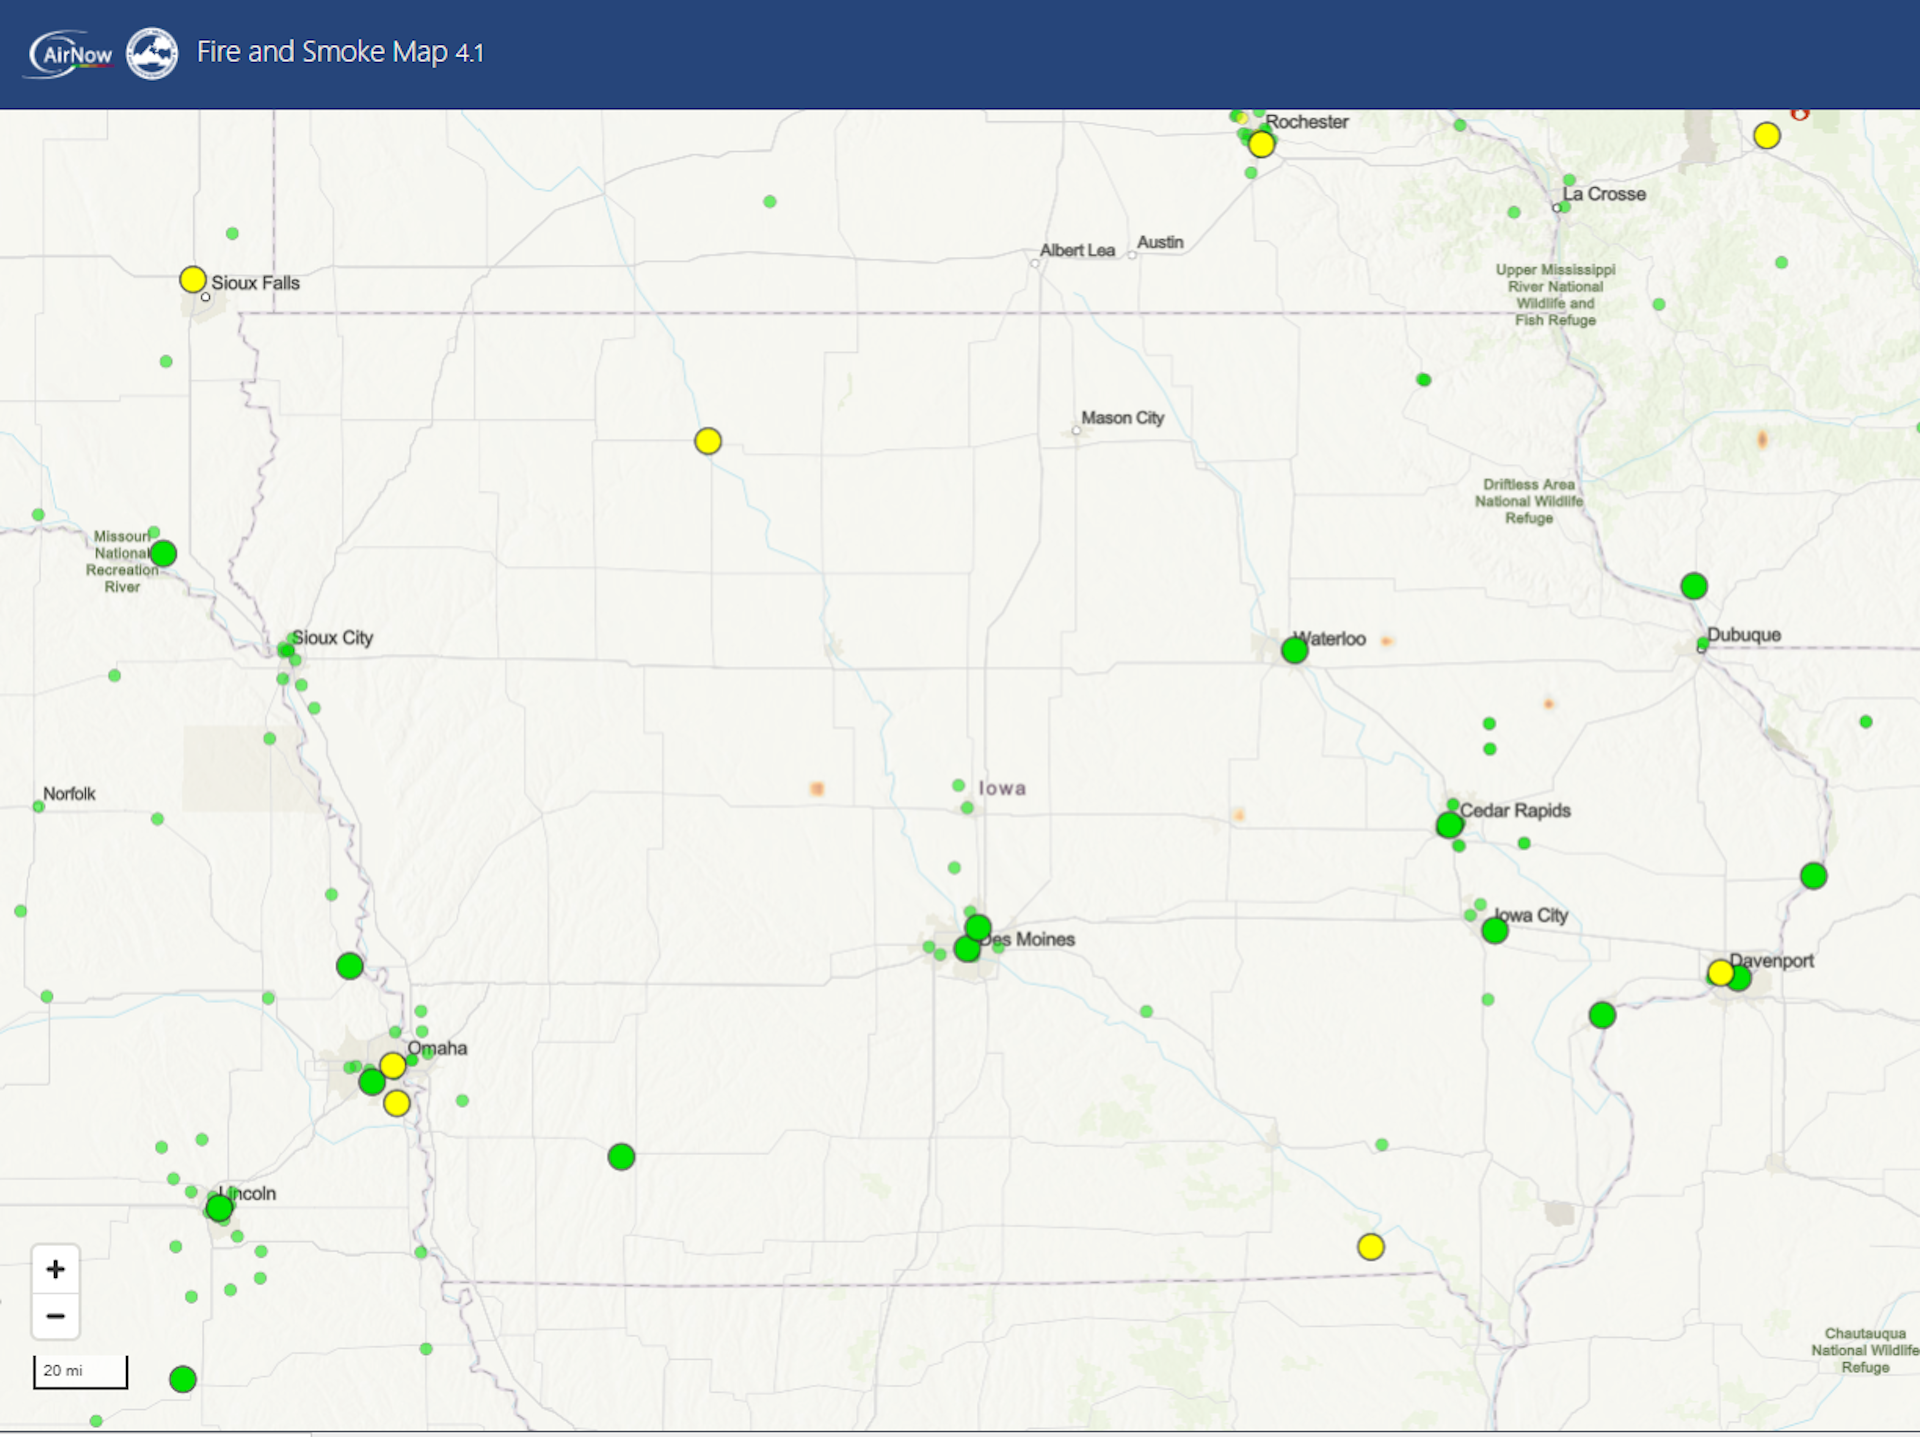
That’s a big jump from relying on ground-based air quality monitors, which may be hundreds of miles apart. Iowa, for example, had about 50 air quality monitors reporting data on a recent day for a state that covers 56,273 square miles. Most of those monitors were clustered around its largest cities.
NOAA’s AerosolWatch tool currently provides a near-real-time stream of wildfire smoke images from its GOES-R satellites, and the agency plans to incorporate TEMPO’s height data. A prototype of this system from my team’s NASA-supported research project on fire and air quality, called FireAQ, shows how users can zoom in to the neighborhood level to see how high the smoke plume is, however the prototype is currently only updated once a day, so the data is delayed, and it isn’t able to provide smoke height data where clouds are also overhead.
Wildfire health risks are rising
Fire risk is increasing across North America as global temperatures rise and more people move into wildland areas.
While air quality in most of the U.S. improved between 2000 and 2020, thanks to stricter emissions regulations on vehicles and power plants, wildfires have reversed that trend in parts of the western U.S. Research has found that wildfire smoke has effectively erased nearly two decades of air quality progress there.
Our advances in smoke monitoring mark a new era in air quality forecasting, offering more accurate and timely information to better protect public health in the face of these escalating wildfire threats.
![]()
Prof. Wang’s group have been supported from NOAA, NASA, and Naval ONR to develop research algorithm to retrieve aerosol layer height. The compute codes of the research algorithm were shared with colleagues in NOAA.
– ref. Is that wildfire smoke plume hazardous? New satellite tech can map smoke plumes in 3D for better air quality alerts at neighborhood scale – https://theconversation.com/is-that-wildfire-smoke-plume-hazardous-new-satellite-tech-can-map-smoke-plumes-in-3d-for-better-air-quality-alerts-at-neighborhood-scale-259654


