Weather apps might see that a storm is coming, but mesonets capture what’s happening as it arrives with local real-time data.Patrick Emerson/Flickr, CC BY-SA
Whether you’re planning a weekend hike, deciding what to wear to work or preparing your home for severe storms, the weather forecast is essential. You might instinctively grab your smartphone and check an app for an instant weather update.
But how many times have you looked at your app, only to step outside and see the sky painting a different picture than what’s on your screen?
Before you blame the local forecasters, let’s talk about where the data in your weather app comes from, and why it might not always show what you expect. It’s why my colleagues and I are working to bring forecast data closer to home.
If you want a perfect weather forecast, you will have to precisely measure every molecule of the atmosphere, land and water, and perfectly predict how they will interact with each other for the next minute, day or week. This is, of course, physically impossible.
Instead, scientists run computer models. These models take the observations we do have and simulate the weather on a large scale to a remarkable degree of accuracy. In fact, storm track forecasts from the National Hurricane Center were among its best ever in 2025, and forecasts using machine learning are starting to improve those forecasts even further.
These models are hungry for data. Supercomputers ingest measurements from satellites, weather balloons, Doppler radar, lightning detection networks, buoys, surface weather stations and other measurement platforms to solve the equations that provide weather predictions.
When you open your phone, your weather app isn’t doing the meteorology – it’s just showing the output of the model’s calculations. Even though they generally aren’t tailored by a local meteorologist, these short-term forecasts are usually pretty good. But they could be better.
All weather is local
You’ve probably seen it before: It’s raining on one side of the street and not on the other. You flip on the news to see the nearest airport received an inch of rain, but your garden is dry.
There are more than 2,500 airports in the United States with weather stations, which is where much of the weather data shared on TV and online is collected. But for many people, the closest airport is more than 20 miles (32 kilometers) away. This is especially true in rural areas.
All of the areas in green are more than 20 miles from an airport weather station. In many cases, that means they’re 20 miles or farther from the weather observations feeding their local forecasts. Chris Vagasky
Because of the chaotic nature of weather, the only way to truly know what’s happening in your yard is to measure the weather in your yard. But not everyone is interested in installing a rain gauge or personal weather station.
Filling the gaps
To bridge this gap, manystates and universities have established local weather station networks called mesonets – short for mesoscale networks, meaning intermediate scale. These weather stations are installed in locations to ensure everyone in the state is within 20 miles of the nearest station.
Like the weather stations at airports, mesonets measure things like air temperature and relative humidity, air pressure, rainfall or melted snow, and wind speed and direction – often every five minutes.
Many mesonets collect additional data such as soil moisture levels to help farmers. Some even have camera images updated every five minutes to show current weather conditions. Mesonet data is then shared through websites or direct data transmission so that the public, weather forecasters and researchers can easily access it.
I lead the team at Wisconet, a new mesonet that just finished installing 78 weather stations across Wisconsin. Our stations are installed on 10-foot-tall (3-meter) tripods in open areas near orchards and cranberry marshes, farms and airfields, schools and other educational centers, and on city, state and federally owned lands.
Wisconet weather stations, like this one in Amery, Wisc., provide local weather data for areas where forecasts used to be based on what was happening many miles away. Caitlin Wienkes, Wisconet
These added weather stations are already proving useful. On Aug. 18, 2025, slow-moving thunderstorms moved over a Wisconet station, with more than 3 inches of rain falling in just a couple of hours. The National Weather Service was able to issue a flash flood warning for the area because of the data provided by that station.
In addition to providing a near-real-time snapshot of the local weather, mesonets help farmers decide when to run irrigation systems, spray pesticides or plant crops. They also help provide better weather warnings, particularly when tornadoes and other storms intensify over small areas that farther-away weather stations would miss.
A nationwide network of networks
Because of the immense value of high-frequency weather and soil measurements, the National Oceanic and Atmospheric Administration leads a National Mesonet Program. The program collects weather data from public, private and academic sources, validates the quality of the data, and ensures it flows to users, including the National Weather Service. National Weather Service forecasters use that data to make more timely and accurate severe weather warnings.
Congress is considering expanding that program, with legislation proposed in the House and the Senate. The bills aim to authorize $50 million to $70 million annually to the National Mesonet Program between 2026 and 2030 to improve and expand mesonets across the country. An expansion would mean more weather stations and new capabilities, like real-time snowfall, fire weather and air quality measurements, closer to the people who rely on them.
So the next time you check your smartphone and grumble because the app doesn’t match the weather in your backyard, remember that all weather is local. If you don’t have a nearby mesonet station, the nearest measurements may be many miles away.
This work is supported by the Institute for Rural Partnerships, project award no. 2023-70500-38915, from the U.S. Department of Agriculture’s National Institute of Food and Agriculture. Any opinions, findings, conclusions, or recommendations expressed in this publication are those of the author and should not be construed to represent any official USDA or U.S. Government determination or policy.
Wisconet receives monthly payments for their data from the National Mesonet Program.
Educators, policymakers and parents were genuinely excited in the late 2010s, when three Southern states – Alabama, Mississippi and Louisiana – appeared to buck the literacy trend. All three of these states, which have long lagged in literacy scores, made notable gains in fourth grade reading scores from 2013 to 2024, as measured by the National Assessment of Educational Progress, or NAEP.
We are researchers in literacy and learning. Two of us are at the University of Alabama and Mercer University, where we educate elementary teachers. The other two work at Temple University, where we research early language and the science of learning. We all study how children develop as readers and how teaching styles and policies shape that development.
A straightforward explanation has taken hold: As more schools spent additional time on phonics and implemented other “science of reading” reforms, students became stronger readers.
This narrative accurately captures some of the available evidence. But it also simplifies a complex set of patterns in literacy data, and it limits the discussion that policymakers should have.
Since the early 2000s, new federal and state policies have placed pressure on schools to improve students’ reading outcomes. The 2001 No Child Left Behind Act required all states to track and report literacy testing results. This law, which the Obama administration replaced in 2015 with the Every Student Succeeds Act, mandated annual testing in reading and math for students in third through eighth grades.
The NAEP found that fourth grade reading scores nationwide increased modestly beginning in 2005. They peaked around 2017 and have declined since.
But there’s a complication in how those scores are interpreted. NAEP’s mid-level score, called “proficient,” does not mean a student is reading at grade level – it reflects a high standard that most students do not reach. In the case of fourth grade readers, it means they can recognize a text’s structure and organization, explain how characters influence others and make other complex observations. Students can also receive a lower “basic” score, or a higher “advanced” one.
Alabama’s example illustrates the gap that can emerge between NAEP test results and a state’s assessments.
Mississippi’s progress predates recent national attention to the science of reading – meaning, the body of research on reading – suggesting its gains cannot be attributed solely to the current wave of related reforms.
In 2013, Mississippi passed the Literacy-Based Promotion Act, which combined early reading screening, teacher training, literacy coaching and additional support. Research shows that the policy could account for roughly five points of reading gains, on average. These gains reflect long-term, system-wide efforts rather than a rapid shift tied to a single policy change.
At the middle school level, however, the pattern in Mississippi looks different.
Improvements in fourth grade reading have not translated into similar gains in eighth grade reading. Early improvements in children’s ability to decode words do not necessarily lead to success with more complex texts that require additional vocabulary and background knowledge.
This gap does not negate Mississippi’s progress, but it does raise questions about what the next decade of work needs to look like.
A 32-point gap between Black and white students’ average fourth grade reading scores persists in 2024 data, nearly unchanged from the late 1990s. In this case, some reading progress happened. Yet the underlying inequities between students did not shift.
Alabama’s results illustrate a third pattern: relative stability in fourth grade reading scores during a period of national decline. The state ranked 35th in fourth grade NAEP reading in 2013 and remains in a similar position in 2024, showing little change.
The state’s average NAEP score for fourth grade students shifted by a single point between 2019 and 2024 – not a surge, but a state holding its ground while others fell.
The same pattern extends nationally to Hispanic students, poor students and other groups. This shows that fourth grade students’ reading gains have not been accompanied by comparable reductions in social, racial and ethnic inequities.
Test score changes reflect a combination of policy decisions, classroom practices and broader conditions, often unfolding over many years. Reading is hard to teach, hard to sustain and not connected to any one policy shift.
The authors do not work for, consult, own shares in or receive funding from any company or organization that would benefit from this article, and have disclosed no relevant affiliations beyond their academic appointment.
Chronic obstructive pulmonary disease, or COPD, caused 141,733 deaths in the United States in 2023 – the latest data that has been reported. That number reflects not just the effects of smoking, but a broader set of medical and social factors that shape who survives.
I am a physician and doctoral researcher in public health who studies chronic disease outcomes using nationally representative U.S. data. In my research examining long-term mortality among adults living with COPD, one pattern stands out clearly: My colleagues and I found that both current and former smokers had a higher risk of death compared with those who never smoked, highlighting that smoking increases mortality risk – but it does not act alone.
How smoking and COPD are intertwined
Smoking has been recognized for over five decades as the primary cause of COPD. It is a major factor in how the disease develops and progresses, although other factors such as secondhand smoke, air pollution and occupational exposures also play a role. Even after accounting for age and other health conditions, people with COPD who have smoked face a higher risk of death than those who have never smoked.
Quitting smoking, while essential, does not fully erase the damage caused by smoking. This is because long-term exposure to tobacco smoke leads to persistent inflammation and structural damage in the lungs, changes that are not fully reversible. They continue to affect airflow and respiratory function even after a person stops smoking, although quitting significantly slows further decline.
People living with COPD also face a higher risk of other health problems, including lung infections such as flu or pneumonia, lung cancer, heart disease, weak muscles and depression or anxiety, all of which can increase the risk of death.
One of the most noticeable ways COPD affects daily life is through persistent breathlessness, which can make even simple tasks such as walking, cooking or getting dressed more difficult. As activity declines, overall health can worsen, creating a cycle that is hard to break.
A growing body of research shows that social factors play a meaningful role in health outcomes with chronic diseases including COPD. Social isolation has been linked to a higher risk of premature death, with effects comparable to well-known risk factors such as smoking and obesity. This is a major problem because nearly 1 in 6 adults with COPD experience social isolation, and 1 in 5 experience loneliness.
Among people living with COPD who were single or never married, the increase in overall risk of death associated with smoking was substantially higher. In this socially isolated group, current smokers faced roughly a 50% higher risk of death and former smokers faced nearly four times the risk compared with those who never smoked, highlighting how social context can shape survival rates.
Other research has similarly found that social isolation is associated with a higher risk of death among people with COPD, reinforcing the importance of social support. Managing a demanding chronic illness alone can be difficult; without support to monitor symptoms or assist with care, the burden of disease may be grave.
One reason is that social connections influence how people manage chronic illnesses. People who are socially isolated are more likely to engage in unhealthy behaviors such as smoking, poor diet and physical inactivity, and may be less likely to follow treatment plans.
Support from family members, caregivers or community networks can improve peoples’ likelihood of following treatments, reduce their stress and make it easier to quit smoking. For people living with COPD, a condition that requires daily management, these differences can significantly affect their quality of life and how long they live.
What can help reduce COPD deaths?
Reducing deaths from COPD begins with prevention and early intervention. Avoiding or quitting smoking remains the most effective way to lower risk. Reducing exposure to tobacco smoke, air pollution and occupational hazards such as dust from mining and chemical fumes can also help prevent long-term lung damage.
For people already living with COPD, consistent access to care can improve outcomes. Treatments such as inhalers that help open the airways, pulmonary rehabilitation and oxygen therapy, along with vaccinations against respiratory infections, can help manage symptoms and reduce complications.
Improving survival in COPD depends on more than treatment alone – it also requires addressing social factors such as isolation, access to support and living conditions.
One practical step is making screening for social isolation part of routine care.
Olamide Asifat does not work for, consult, own shares in or receive funding from any company or organization that would benefit from this article, and has disclosed no relevant affiliations beyond their academic appointment.
Keeping tabs on blood sugar throughout the day used to be the exclusive domain of people with diabetes. But in 2026, anyone can buy a user-friendly wearable device that provides minute-by-minute readouts on how their glucose levels respond to food and movement.
These glucose numbers are increasingly being tracked by people who are healthy but want to lose weight or optimize their wellness.
I am a behavioral scientist who has spent the past decade studying how real-time data captured through wearable sensors and mobile technologies can help promote a healthier lifestyle. I’ve found that for people who don’t have diabetes, using such a device for a few weeks can bring insight into how their body reacts to their eating patterns and daily habits.
But researchers still don’t know how these fluctuations affect health for people who don’t have diabetes. In the absence of meaningful metrics for interpreting these numbers, monitoring a constant stream of data doesn’t directly help people make health-related decisions and can lead to confusion and needless anxiety.
What are glucose levels – and why track them?
Glucose is a type of sugar that circulates in the bloodstream after being absorbed from food. It is the body’s primary source of energy.
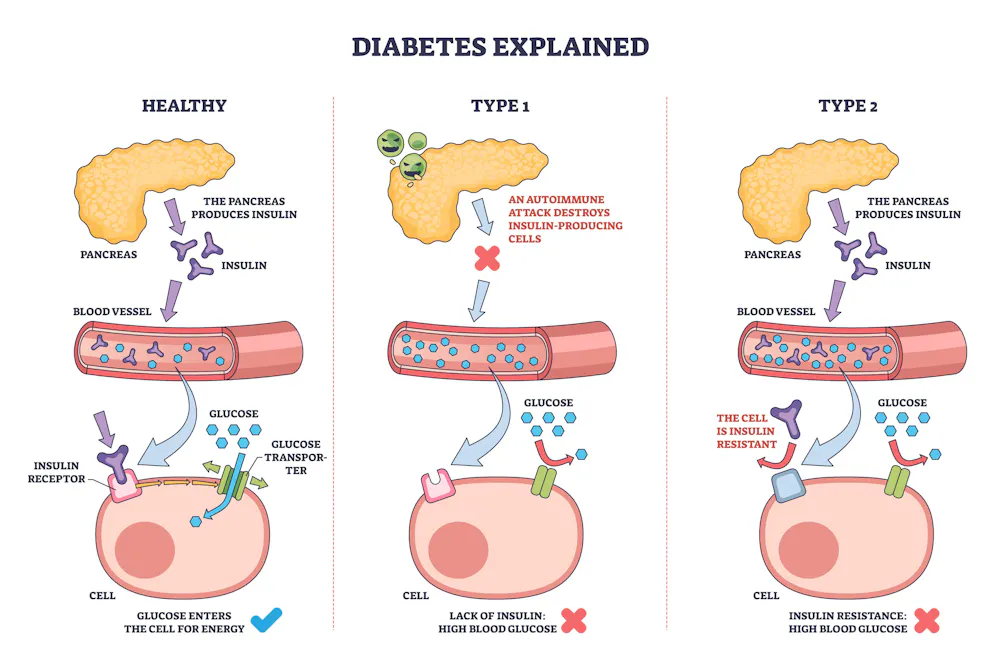
For people without diabetes, glucose levels generally stay in the range of 70-120 milligrams per deciliter (mg/dL) of blood throughout the day. After eating or drinking, levels could exceed 140 mg/dL but should come down to the normal range within a couple of hours. That’s because the pancreas responds to a glucose spike by releasing a hormone called insulin, which brings the glucose number down.
A healthy range for glucose levels is between 70 and 120 milligrams per deciliter. For people with diabetes, glucose levels generally run high. piyaset/iStock via Getty Images Plus
Glucose levels generally run high with diabetes. People with Type 1 diabetes, whose bodies don’t make enough insulin, rely on glucose numbers to tell them when to take a dose of insulin. People with Type 2 diabetes use the numbers to monitor the effect of their medications and lifestyle changes and to get a fuller picture of their glucose control.
From test strips to AI-enabled sensors
Devices that track glucose numbers have been around since the early 1970s. Early versions consisted of test strips that detected glucose levels in urine. Finger prick tests, or glucometers, which were developed in the 1980s, are still used by some people today and measure them more directly by applying a tiny blood drop to a test strip.
To make the technology more convenient, companies in the early 2000s developed continuous monitoring devices that consist of tiny sensors inserted just under the skin that detect glucose in fluid that surrounds cells. Initially, these devices could give readings every 15 minutes for several days at a time, but recent versions sample more frequently.
Today, the technology has evolved even further. The most advanced glucose monitors under development come in the form of watches or rings with noninvasive sensors that use light-based techniques to detect glucose in body fluids. Many also rely on machine learning to provide more accurate readings by detecting each person’s unique physiological patterns over time.
For decades, continuous glucose monitors were available only with a doctor’s prescription. But in March 2024, the Food and Drug Administration approved the first over-the-counter continuous glucose monitor in the U.S., making them widely accessible.
Glucose monitoring for diabetes
There’s no doubt that continuous glucose monitors are a game-changer. People living with diabetes rely on these devices to track what percentage of the day their blood glucose stays within healthy limits – a measure called “time in range.” Patients make decisions about managing their condition – for example, when to take insulin – on guidelines developed by researchers and physicians based on that measure.
According to a 2026 report from the Centers for Disease Control and Prevention, almost 11 million adults who have diabetes – more than 1 in 4 adults with the condition – are undiagnosed. Type 2 diabetes can develop slowly and silently, often with no noticeable symptoms for years except glucose levels that remain elevated for a majority of the day, including when people are sleeping. Tracking glucose levels might offer clues that glucose is elevated.
Tracking glucose levels may also benefit the 115.2 million Americans – 43.5% of all U.S. adults – who have a condition called prediabetes. Prediabetes is when a person’s metabolic system shows early warning signs of diabetes but they don’t have the full-blown disease.
Prediabetes generally has no noticeable symptoms, but it is reversible – meaning, it’s possible to shift your glucose levels back into a healthy range. Tracking your glucose number can reveal how diet and exercise affect it. Observing how a soda spikes your glucose levels, for example, might give you pause before you drink one next time.
Daily glucose rhythms
Increasingly, though, people who use continuous glucose monitor aren’t diabetic – or even prediabetic. Instead, they want to understand how their bodies react to activities in their daily lives.
Diet, exercise and other lifestyle behaviors have long-term effects on health. Weight loss, for example, happens slowly. Changes in blood glucose, on the other hand, are more immediate. Tracking glucose levels thus offers real-time feedback on how your body responds to the food you just ate or the workout you just finished.
In studies I’ve conducted with colleagues, many people have found this information powerful. They were surprised to learn that eating certain foods – sugary soda, or even something healthy like a banana – causes their glucose levels to spike.
Seeing your glucose levels changing in real time can spur insights, but if you don’t have diabetes there are no guidelines for how to respond to those fluctuations.
One study participant told us that seeing their real-time glucose numbers led them to make more intentional dietary choices, such as cutting back on snacking. “I’m more aware and I’m making the changes,” they explained. Another participant also noted behavior changes prompted by continuous glucose monitoring, such as trying to avoid eating so late in the evening and consuming only half a fast-food meal.
That initial wow factor – and its capacity to motivate people to make healthy lifestyle changes – may be valuable. But it’s not clear how long these changes last, or how exactly people should respond to fluctuations in their glucose number to decrease their diabetes risk or to address other health issues.
Researchers like me and my team are exploring exactly these questions.
Building a dynamic picture of how glucose levels fluctuate throughout the day in people without diabetes may point to early indicators for various chronic diseases. For example, my colleague and I recently developed a mathematical model to examine how monitoring glucose levels during sleep might help predict the risk of metabolic diseases – such as Type 2 diabetes, heart disease or fatty liver disease – in people with and without diabetes.
Additionally, continuous glucose data may reveal how people’s bodies might react differently to the same food, workout or other activity. Understanding how each person’s biology responds to the choices they make throughout the day could eventually lead to a more personalized approach to lifestyle changes that can help people maintain their health.
Liao Yue receives funding from the American Institute for Cancer Research, the American Heart Association, the Cancer Prevention & Research Institute of Texas and the Texas Higher Education Coordinating Board.
For the first time in almost 80 years, U.S. service members will no longer be mandated to receive the annual influenza vaccine.
Defense Secretary Pete Hegseth announced the change on April 22, 2026. Citing medical autonomy and religious freedom, he described the requirement as “overly broad and not rational,” telling troops that “your body, your faith and your convictions are not negotiable.”
The flu shot requirement that Hegseth ended had been in place since 1945, with one brief pause in 1949. It was part of a tradition of military vaccine mandates nearly as old as the United States itself.
The first American military vaccine mandate predates the Constitution. In the winter of 1777, Gen. George Washington ordered the mass inoculation of the Continental Army against smallpox.
His decision wasn’t ideological – it was strategic. The year before, a smallpox outbreak had torn through American troops outside Quebec, contributing to the collapse of the northern campaign. John Adams famously wrote to his wife, Abigail, that smallpox was killing 10 soldiers for every one felled in battle.
Inoculation in 1777 was itself risky. The procedure, called variolation, involved deliberately infecting a soldier with a small amount of smallpox virus to build immunity. Washington gambled that losing some to inoculation was better than losing a war to the virus. Historians have credited the decision with saving the Continental Army.
The COVID-19 pandemic reframed the politics surrounding vaccine mandates.
The 1918 pandemic made clear that a respiratory virus could cripple an army. In 1941, as the country prepared to enter another world war, the U.S. Army organized an influenza commission that partnered with the University of Michigan to develop the first influenza vaccine. Clinical trials in military recruits showed that the vaccine reduced the incidence of influenza illness by 85%, and in 1945 the military mandated the vaccine. Roughly 7 million service members were vaccinated that year.
The mandate was briefly paused in 1949 after scientists realized the vaccine needed regular updates due to the virus changing. Once formulations could be adjusted seasonally, the mandate returned in the early 1950s and has stayed in place continuously – until Hegseth’s change of policy.
In 2023, Congress passed a law requiring the Pentagon to rescind the military COVID-19 vaccine mandate. This reversal reframed the politics of military vaccine requirements. In January 2025, President Donald Trump ordered the reinstatement, with back pay, of troops discharged over COVID-19 vaccine refusal.
In announcing the end of the flu mandate, Hegseth relied heavily on “medical freedom” language that emerged from the COVID-19 vaccine debate, rather than on any new evidence about influenza or the effectiveness of the flu vaccine.
The medical freedom movement opposes government involvement in what its supporters see as personal health decisions – including public health recommendations such as vaccine mandates, masking and social distancing.
Does the vaccination rationale still hold?
Critics of the military flu vaccine mandate argued that flu is a milder threat than it was in 1918, that service members are healthier than the general population and that personal choice should outweigh public health logic for a seasonal virus.
The epidemiology tells a different story.
Although flu seasons can vary in disease severity, the virus mutates so unpredictably that pandemic flu seasons – like those in 1918, 1957, 1968 and 2009 – are a recurring possibility. Flu still hospitalizes and kills tens of thousands of Americans annually. The Centers for Disease Control and Prevention estimates the influenza vaccine prevented roughly 180,000 hospitalizations and 12,000 deaths during the 2024-2025 season.
The military operates in precisely the conditions that favor the spread of respiratory viruses: recruit training centers, barracks, ships and submarines where people live in close quarters.
The logic that drove Washington in 1777 and the Army surgeon general in 1945 to require vaccination hasn’t really changed. A sick soldier can’t deploy, can’t train and can spread illness through an entire unit.
What has changed is the political weight assigned to individual refusal – and that, more than the biology of the flu or the effectiveness of the vaccine, is what the end of this mandate reflects.
Katrine L. Wallace does not work for, consult, own shares in or receive funding from any company or organization that would benefit from this article, and has disclosed no relevant affiliations beyond their academic appointment.
Source: The Conversation – France in French (3) – By Mickael Naassila, Professeur de physiologie, Directeur du Groupe de Recherche sur l’Alcool & les Pharmacodépendances GRAP – INSERM UMR 1247, Université de Picardie Jules Verne (UPJV)
Anticoagulants, antihypertenseurs, diurétiques, anxiolytiques, antidépresseurs, antidiabétiques, anticancéreux… tous ces médicaments apparemment sans grand rapport les uns avec les autres ont pourtant un point commun : ils sont sensibles aux interactions avec l’alcool. Consommer une boisson alcoolisée alors que l’on est sous traitement entraîne potentiellement des effets variés, dont certains peuvent être graves.
Vous sortez de la pharmacie avec dans votre sac un traitement contre la douleur, l’anxiété, l’hypertension ou le diabète. Votre pharmacien vous a très certainement expliqué la dose de médicament à prendre, et sur quelle durée. Il s’est peut-être attardé sur les effets secondaires potentiels. Il est possible qu’il vous ait aussi demandé si vous fumiez. Mais souvent, une question reste absente de ce type d’échange : vous arrive-t-il de consommer de l’alcool ?
L’association entre consommation d’alcool et médicaments est pourtant l’une des situations les plus fréquentes du quotidien. Elle concerne des millions de personnes, souvent sans qu’elles en aient conscience. Or, l’alcool peut modifier l’efficacité d’un traitement, en augmenter la toxicité ou amplifier certains effets indésirables, parfois avec des médicaments très courants.
Derrière cette réalité se cachent des mécanismes biologiques complexes, mais dont les conséquences sont très concrètes : chute, malaise, saignement, hypoglycémie, surdosage, inefficacité du traitement, ou aggravation silencieuse d’une maladie chronique.
Et contrairement à une idée reçue, il ne s’agit pas seulement d’un problème lié aux somnifères ou aux « gros buveurs ».
Une problématique fréquente
L’association entre alcool et médicaments potentiellement susceptibles d’interagir avec cette substance est loin d’être marginale. Aux États-Unis, l’analyse de l’enquête nationale NHANES (1999–2010) a estimé que 42,8 % des adultes utilisaient au moins un médicament susceptible d’une telle interaction, une proportion qui dépasse 75 % après 65 ans. En Suisse, environ une personne de 55 ans ou plus sur cinq déclarait consommer souvent ou presque toujours de l’alcool en même temps que ses médicaments.
Chez les sujets les plus âgés qui prennent plusieurs sortes de médicaments, le risque devient encore plus marqué : certaines études rapportent que la grande majorité des patients sont exposés à au moins une interaction potentielle. Autrement dit, il ne s’agit pas d’une situation rare ou exceptionnelle, mais d’une réalité fréquente du quotidien, particulièrement chez les personnes âgées.
Alcool et médicaments : une relation qui n’est pas neutre
Lorsque l’on prend un médicament, celui-ci ne fait pas qu’« agir » dans notre organisme. Il est absorbé, distribué dans notre corps, transformé par le foie, puis éliminé. Toutes ces étapes constituent la pharmacocinétique du médicament. Et l’alcool peut interférer avec chacune d’elles.
Le foie joue ici un rôle central. En effet, c’est lui qui métabolise non seulement l’alcool, mais aussi une grande partie des médicaments. Or, lorsque deux substances empruntent les mêmes voies biologiques, elles peuvent se gêner mutuellement.
Mécanismes par lesquels l’alcool modifie l’efficacité des médicaments. Naouras Bouajila
Deux situations doivent être distinguées, la consommation ponctuelle et la consommation régulière, car leurs effets sur les traitements ne sont pas les mêmes.
Consommation ponctuelle : quand le médicament s’accumule
Lors d’une prise aiguë d’alcool, un apéritif, un dîner arrosé, une soirée, l’organisme mobilise en priorité ses systèmes de dégradation de l’éthanol, notamment au niveau hépatique. Pour cela, le foie utilise diverses enzymes. Or, certains médicaments sont métabolisés par ces mêmes enzymes. Résultat : ceux-ci sont éliminés plus lentement. Leur concentration dans le sang augmente, ce qui augmente le risque d’effets indésirables ou de toxicité.
Ce phénomène peut être particulièrement problématique avec les médicaments dits « à marge thérapeutique étroite », c’est-à-dire ceux pour lesquels un faible écart de dose ou de concentration peut suffire à provoquer un effet excessif ou dangereux.
Autrement dit, un verre peut parfois faire « trop agir » un médicament.
Consommation régulière : quand le traitement devient moins efficace, ou plus toxique
À l’inverse, une consommation chronique d’alcool modifie durablement le fonctionnement du foie. Celui-ci augmente la production de certaines enzymes de biotransformation (notamment le cytochrome P450 2E1 ou CYP2E1). Ce phénomène est appelé « induction enzymatique ». Conséquence : certains médicaments sont dégradés plus rapidement qu’attendu. Ils restent moins longtemps à des concentrations efficaces, ce qui peut réduire leur effet thérapeutique.
Par ailleurs, cette adaptation a un revers. Elle favorise aussi la formation de métabolites réactifs, parfois toxiques. L’exemple le plus connu est celui du paracétamol. Après avoir été absorbé, une partie de ce médicament est transformée en un composé toxique pour le foie, la N-acétyl-p-benzoquinone imine (NAPQI). Normalement, ce métabolite est neutralisé par un composé appelé glutathion.
En cas de consommation d’alcool, la toxicité du paracétamol peut être accrue. DR, Fourni par l’auteur
Cependant, chez les consommateurs chroniques d’alcool, la production de NAPQI peut augmenter, car le foie fabrique de plus grandes quantités de l’enzyme CYP2E1, qui transforme le paracétamol en métabolite toxique. Dans le même temps, les réserves de glutathion diminuent : elles sont davantage consommées pour neutraliser ce toxique, et souvent moins bien reconstituées en raison de l’alcool, de la dénutrition ou d’une maladie du foie. Cela majore le risque de lésions hépatiques, parfois même lorsque les médicaments sont pris à des doses usuelles.
Distribution, déshydratation, élimination : des effets moins visibles mais importants
La déshydratation qu’il favorise peut réduire le volume de distribution de certains médicaments hydrosolubles (solubles dans l’eau, ndlr) et augmenter leur concentration dans le plasma sanguin.
Les modifications de la composition corporelle observées chez certains consommateurs chroniques d’alcool, notamment une augmentation relative de la masse grasse, peuvent aussi favoriser l’accumulation de molécules lipophiles (qui présentent une « attirance » pour les tissus gras) et prolonger leur durée d’action.
Enfin, lorsqu’une consommation prolongée a altéré le foie ou les reins, les capacités d’élimination diminuent. Les médicaments s’accumulent alors plus facilement, exposant à un risque accru de surdosage ou d’effets indésirables prolongés.
Souvent invisibles pour le patient, ces mécanismes modifient profondément l’équilibre entre bénéfice et risque du traitement.
Soulignons que, lors du développement d’un médicament, certaines interactions pharmacocinétiques peuvent être étudiées, notamment si un risque est suspecté. Toutefois, les essais cliniques incluent souvent peu de buveurs importants. En outre, ils excluent les patients fragiles et évaluent mal les consommations réelles d’alcool (ponctuelles, chroniques ou variables).
Après la mise sur le marché, la pharmacovigilance peut détecter des signaux d’alerte, mais l’alcool est fréquemment sous-déclaré ou non recherché. Résultat : de nombreuses interactions avec l’alcool restent probablement sous-estimées et passent donc sous les radars.
Quand les effets s’additionnent : les interactions pharmacodynamiques
Dans ce cas, l’alcool ne change pas forcément la concentration ou la distribution du médicament, mais la manière dont le corps y répond.
L’alcool agit principalement comme un dépresseur du système nerveux central (cerveau et moelle épinière). Il en renforce le principal système inhibiteur (la transmission GABAergique), tout en freinant le fonctionnement de structures moléculaires impliquées dans l’excitation neuronale (les récepteurs glutamatergiques NMDA).
Ce double effet entraîne sédation, ralentissement psychomoteur, troubles de la vigilance, altération des réflexes et baisse des performances cognitives. En d’autres termes, l’alcool ralentit l’activité générale du cerveau ainsi que le fonctionnement du corps et diminue le niveau d’éveil.
Lorsque des médicaments agissant sur ces mêmes voies sont associés à l’alcool, leurs effets ne s’additionnent pas simplement : ils se potentialisent. C’est le cas notamment :
des benzodiazépines (par exemple, l’alprazolam – nom commercial Xanax – ou le bromazépam – nom commercial Lexomil) ;
des hypnotiques (par exemple, le zolpidem – nom commercial Stilnox – ou la zopiclone – nom commercial Imovane) ;
des opioïdes (par exemple, la morphine, que l’on trouve notamment dans le médicament commercialisé sous le nom de Tramadol) ;
de certains antihistaminiques sédatifs (par exemple, l’hydrozine – nom commercial Atarax ou la dexchlophéniramine – nom commercial Polaramine) ;
de plusieurs psychotropes (par exemple, Tercian pour la cyamémazine, Largactil pour la chlorpromazine).
Sur le plan clinique, cela peut se traduire par une somnolence majeure, une confusion, des troubles de la coordination, des chutes, des accidents domestiques ou de la route.
Dans les cas les plus graves, en particulier avec les opioïdes ou certains anxiolytiques, la dépression du système nerveux central peut atteindre les centres respiratoires et devenir potentiellement fatale, les patients n’étant plus capables de respirer.
Une réaction parfois brutale : l’effet « antabuse »
Certaines interactions sont plus spectaculaires encore. En temps normal, l’alcool est transformé en acétaldéhyde, puis rapidement converti en acétate grâce à une enzyme appelée aldéhyde déshydrogénase (ALDH).
Mais certains médicaments bloquent cette seconde étape. L’acétaldéhyde s’accumule alors dans l’organisme, provoquant une réaction dite de type « antabuse ».
Les symptômes peuvent apparaître rapidement : rougeur du visage, céphalées, nausées, vomissements, tachycardie, hypotension, malaise intense.
Ce mécanisme est utilisé volontairement avec le disulfirame dans la prise en charge de la dépendance à l’alcool. Le principe n’est pas de « guérir » directement l’addiction, mais de créer une forte dissuasion : si la personne boit, elle risque un malaise rapide et désagréable.
Si le disulfirame est bien un médicament (en médecine, un traitement peut agir soit en corrigeant un mécanisme biologique, soit en modifiant un comportement ou en prévenant une rechute), son utilisation soulève toutefois des questions éthiques : elle n’est acceptable que si le patient est clairement informé, volontaire et accompagné médicalement. Aujourd’hui, il est moins utilisé qu’autrefois, mais peut rester utile dans certaines situations bien encadrées.
Des réactions similaires peuvent aussi survenir avec d’autres médicaments, notamment certains antibiotiques, comme le métronidazole, ou certains antifongiques.
Il faut avoir à l’esprit que, parfois, de faibles quantités d’alcool suffisent, y compris celles contenues dans des sirops, des bains de bouche ou dans certaines préparations alimentaires…
Des interactions fréquentes avec des traitements très courants
Le sujet des interactions avec l’alcool dépasse largement les médicaments « à risque évident ». Certains médicaments utilisés couramment sont aussi concernés par cette problématique.
– Anticoagulants et antithrombotiques : la consommation chronique d’alcool peut augmenter le risque hémorragique. Elle favorise les lésions digestives (gastrites, ulcères, varices œsophagiennes), perturbe l’agrégation plaquettaire et peut altérer la coagulation via l’atteinte hépatique ;
– Antihypertenseurs : une consommation aiguë peut entraîner une vasodilatation (dilatation des vaisseaux sanguins), une chute tensionnelle, des vertiges ou une syncope. À l’inverse, une consommation chronique favorise l’hypertension et peut compliquer le contrôle du traitement ;
– Diurétiques et bêtabloquants : l’association peut majorer l’hypotension. Dans certains cas, l’alcool peut aussi aggraver bradycardie ou malaise ;
– Psychotropes, anxiolytiques, hypnotiques, antidépresseurs, antipsychotiques : l’alcool augmente souvent la sédation, la confusion, les troubles de la mémoire et le risque de chute ;
– Antidiabétiques : l’alcool inhibe la production de glucose (néoglucogenèse) au niveau du foie, ce qui peut favoriser des hypoglycémies parfois sévères, notamment chez les patients traités par insuline ou certains médicaments hypoglycémiants ;
– Traitements anticancéreux : l’alcool peut majorer la toxicité hépatique, aggraver fatigue, troubles digestifs ou atteintes cutanées et, parfois, interférer avec le métabolisme de certaines molécules.
Les classes de médicaments dont la pharmacodynamique est affectée par l’alcool. Naouras Bouajila, Fourni par l’auteur
Un risque qui explose chez les personnes âgées
Les personnes âgées constituent probablement la population la plus exposée aux interactions entre alcool et médicaments.
En effet, avec l’âge, la polymédication devient fréquente. Une part importante des plus de 75 ans prend plusieurs médicaments de façon concomitante, parfois jusqu’à cinq, voire davantage. Or, plus le nombre de traitements augmente, plus le risque d’interactions s’accroît.
S’ajoutent à cette situation des modifications physiologiques en lien avec la vieillesse, telle qu’une diminution de la masse hydrique (la quantité d’eau contenue dans le corps), qui favorise l’augmentation de la concentration sanguine d’alcool. L’augmentation relative de la masse grasse prolonge quant à elle l’action de certains médicaments lipophiles, tandis que la baisse des fonctions rénale et hépatique ralentit l’élimination des médicaments ainsi que, parfois, de leurs métabolites actifs ou toxiques, favorisant leur accumulation et augmentant le risque d’effets indésirables. Enfin, avec l’âge, le cerveau devient plus sensible aux substances sédatives.
Les interactions entre médicaments et alcool se traduisent souvent chez les personnes âgées par des chutes, des fractures, une confusion aiguë, des accidents médicamenteux qui entraînent hospitalisations et perte d’autonomie.
Soulignons que, dans ce contexte, même une consommation d’alcool jugée « modérée » peut produire des effets disproportionnés.
Pourquoi parle-t-on si peu de ce problème ?
Plusieurs raisons peuvent expliquer le fait que la question des interactions entre médicaments et alcool soit si peu abordée : parce que l’alcool est culturellement banalisé ; parce qu’évoquer sa consommation peut paraître intrusif ; parce que le temps manque souvent au comptoir ou en consultation ; parce que ces interactions semblent moins inquiétantes que celles qui peuvent se produire avec d’autres médicaments, etc.
Mais ignorer la question ne la fait pas disparaître. L’alcool est une substance biologiquement active, capable d’interagir avec de nombreux traitements. À ce titre, il devrait faire partie du dialogue thérapeutique, de la même façon que les allergies, le tabac ou les autres médicaments pris en parallèle en font partie. Aujourd’hui, demander à un patient s’il fume est devenu un réflexe de prévention. Demander s’il boit de l’alcool devrait l’être tout autant.
Alors, la prochaine fois que votre médecin rédigera votre ordonnance, ou que vous irez retirer vos médicaments à la pharmacie, demandez simplement : « Y a-t-il une interaction possible avec la consommation d’alcool, même occasionnelle ? »
Cette question, si elle était plus souvent posée de part et d’autre du comptoir, pourrait éviter bien des accidents silencieux…
– Sur le site de la SF2A, lapage AlcoolConsoSciencemet à la disposition des professionnels de santé des informations scientifiquement validées sur l’impact de la consommation d’alcool sur la santé.
Mickael Naassila est membre sénior de l’Institut Universitaire de France IUF. Il est Président de la Société Française d’Alcoologie et d’Addictologie (SF2A) et de la Société Européenne de Recherche Biomédicale sur l’Alcoolisme (ESBRA); Vice-président de la Fédération Française d’Addictologie (FFA) et vice-président sénior de la Société Internationale de recherche Biomédicale sur l”Alcool et les Addictions (ISBRA). Il est membre de l’institut de Psychiatrie, co-responsable du GDR de Psychiatrie-Addictions et responsable du Réseau National de Recherche en Alcoologie REUNIRA et du projet AlcoolConsoScience. Il a reçu des financements de l’ANR, de l’IReSP/INCa Fonds de lutte contre les addictions.
Camille André et Naouras Bouajila ne travaillent pas, ne conseillent pas, ne possèdent pas de parts, ne reçoivent pas de fonds d’une organisation qui pourrait tirer profit de cet article, et n’ont déclaré aucune autre affiliation que leur poste universitaire.
These hot topics for the global health community are central to One Health Atlas – a comprehensive, science-led guide to the wealth of initiatives behind the “One Health approach”.
Below are some excerpts from the book, which maps out the interconnections between human, animal, plant and environmental welfare and details One Health’s widely endorsed but “difficult-to-fund approach” :
Interest in One Health has risen among health institutions at local, regional and global levels, particularly since the 2019 SARS-CoV-2 pandemic.
The One Health approach, which acknowledges the interdependence between human, animal and ecosystem health, is now promoted by the Quadripartite Alliance₁.
It has also been mainstreamed by international financial institutions, such as in the World Bank’s One Health Operational Framework and the IDA20 Policy Commitments on One Health. Donors have begun providing funding or financing (…), not only in pandemic prevention, preparedness and response (PPR), but also increasingly in other streams focused on biodiversity, climate change and more.
However, the financing landscape is highly fragmented with many vertical, mostly public health-centric mechanisms.
They often react to health crises, rather than reducing risk at the source or breaking the panic– neglect cycle. The COVID-19 crisis triggered a paradigm shift, and specific (although limited) funding dedicated to One Health is now emerging, with two major initiatives worth noting.
In 2020, the French Development Agency (AFD) launched its NGO Sector Innovation Facility (FISONG OH), an innovative financial mechanism to support One Health. Initially intended for general NGO financing, this fund provided EUR 2.5 million for One Health projects in 2020.
In 2022, the World Bank (in collaboration with WHO) established the Pandemic Fund, a Financial Intermediary Fund designed to provide a dedicated stream of long-term financing to strengthen PPR capabilities in low- and middle-income countries. This fund has generated nearly USD 2 billion and supports One Health initiatives in 80 % of its projects. The Pandemic Fund managed to raise six US dollars for every dollar in grant funds.
Pragmatic approaches for One Health investments have been proposed through frameworks considering risks, co-benefits and stakeholder financial capacity for a fairer distribution of costs and benefits.
The Pandemic Fund’s first call for proposals also showed strong demand from beneficiary countries for strengthening public health systems, while raising questions about their capacity to effectively integrate One Health into their health systems.
These concerns echo the debates over the inclusion of One Health and financing provisions in the 2025 international Pandemic Agreement, which seeks to strengthen global preparedness for future health crises.
₁. The World Health Organization (WHO), the World Organisation for Animal Health (WOAH), the Food and Agriculture Organization of the United Nations (FAO), and the United Nations Environment Programme (UNEP).
Source: The Conversation – France – By Tiphaine Blanchard, enseignante en gériatrie et nutrition vétérinaire, École Nationale Vétérinaire de Toulouse; Inrae
Pets aren’t just mere companions, they play an active role in improving their owners’ wellbeing. But what does this connection tell us about our lifestyles? A recent study by the National Veterinary School of Toulouse has gauged how attached French pet owners are to their cats and dogs.
Animals – our best mental health allies
The benefits of an animal’s presence on human health are common knowledge. Many studies associate them with cardiovascular risk reduction and show how they can help reduce stress, especially among people who have a strong emotional bond with their pet.
This link is not only behavioural: it also affects our emotional needs. In a society marked by loneliness, anxiety and aging of the population, a dog or a cat sometimes becomes a real psychological support, capable of creating a sense of stability and usefulness in everyday life.
However, this relationship, which although beneficial in many cases, can also become a source of emotional distress. Some people develop an anxious attachment to their pet, characterised by excessive worry at the thought of separation or when the animal falls ill.
In elderly people, even without acute attachment anxiety, forced separation from their pet due to a hospital stay or admission to a nursing home often represents real trauma, as the animal is part of their emotional equilibrium and daily life.
The human-animal relationship as a therapeutic tool
The positive effects of the human-animal bond have now been put to good use in several hospitals and medical welfare programs.
The presence of animals in nursing homes can promote exchanges, rekindle memories, and temporarily help to break the feeling of loneliness among residents. Offering animal mediation in psychotherapy sessions for adolescents is also beneficial. Finally, in some paediatric units, particularly in oncology, specially trained animals accompany patients during care to reduce anxiety and improve wellbeing over the duration of the hospital stay.
More recently, several French police stations introduced kittens to appease victims of violence, an approach inspired by measures already implemented in other parts of the world.
For example, in the United States, specially trained dogs are being brought into some police stations and courtrooms to support victims during hearings. To date, there is no scientific data evaluating their impact in this specific context, but the testimonies are positive. Furthermore, benefits have been reported among professionals: a study with Canadian police officers showed that the presence of dogs in their work environment was perceived to reduce stress and improve wellbeing.
This theme deserves to be explored by dedicated research work to study how contact with an animal helps restore a sense of security post-trauma.
These initiatives, which are becoming more and more widespread, are all based on the same idea: to reinforce human health by building on the relationship with animals. Understanding the complex links between wellbeing, dependency and vulnerability requires a reliable survey instrument, which hadn’t been the case in France until recently.
A first step on the ladder to understanding pet attachment
Nearly 1,900 French dog and cat owners responded to the survey.
How is pet attachment evaluated?
The LAPS scale assigns an attachment score of 0 to 69 (a high score reflects a stronger attachment of an owner to their animal).
In France, dog owners obtained a median score of 58.5 compared to 52 for cats, which is higher than in England, Denmark, or Austria!
Marked differences depending on owners’ profiles
The study highlights several factors influencing the achievement score:
Women score higher than men, a result also observed in other countries.
People living without children also have a higher score, as their animals can sometimes play the role of substitute family figures.
Dog owners have a higher score than cat owners, perhaps due to more active interaction.
People with a higher level of education score lower, perhaps because they tend to express their emotional attachment less.
These trends reflect deep social realities. In a society where loneliness is increasing, families are being reconstituted and remote work is becoming more widespread, animals play a role that’s increasingly affective. They soothe, structure daily life and fill a need for connection that human relationships don’t always satisfy.
When our dogs and cats become our attachment figures
In psychology, attachment theory describes our fundamental need for security and reassurance with an “attachment figure”, often a parent, partner, or… an animal.
Dogs, which are more demonstrative, offer emotional interaction similar to children: they solicit, provoke, and express joy. Cats, which are more independent, sometimes require a more “projective” form of attachment, where the owner interprets their signs of affection.
These differences explain why dogs get higher attachment scores: they actively respond to our human need for connection and reciprocity. But among all the owners, attachment remains something that is real.
What about the impact of pets’ health on their owner’s health?
The French version of the LAPS scale is already being used for other research in France.
One of the research projects is focusing on the impact of dog osteoarthritis on the daily life of its owners. When an animal suffers, it is often the whole household that bears the consequences. People in France can participate in this new study by completing an online questionnaire.
The questionnaire is open to all dog owners in France, whether or not they are affected by osteoarthritis, in order to improve understanding of how dogs’ health affects their owners’ health, and to improve care for dogs and their families.
A weekly e-mail in English featuring expertise from scholars and researchers. It provides an introduction to the diversity of research coming out of the continent and considers some of the key issues facing European countries. Get the newsletter!
Tiphaine Blanchard ne travaille pas, ne conseille pas, ne possède pas de parts, ne reçoit pas de fonds d’une organisation qui pourrait tirer profit de cet article, et n’a déclaré aucune autre affiliation que son organisme de recherche.
Fue todo un esfuerzo: seis meses de trabajo, investigaciones en dos países, viajes al Amazonas y al interior del estado de Minas Gerais, y decenas de entrevistas con investigadores brasileños y australianos —tanto académicos como portadores de los conocimientos ancestrales de los pueblos indígenas—.
«Voces del Sur» surgió de la conexión natural entre The Conversation Brasil y Australia, el país donde nuestro proyecto de divulgación científica a través del periodismo colaborativo, llevado a cabo en asociación directa con científicos, comenzó hace 14 años. Esta conexión también es evidente en las características históricas de Brasil y Australia: naciones continentales relativamente jóvenes del hemisferio sur que comparten legados coloniales similares, poseen una inmensa diversidad de ecosistemas, cuentan con una gran riqueza de recursos naturales (especialmente en agricultura, ganadería y minería) y tienen un gran potencial para la producción de energía renovable.
«Con todas estas similitudes, ¿qué están haciendo ahora los científicos de Brasil y Australia para intentar mitigar los efectos del cambio climático, y qué puede enseñar un país al otro en este proceso? Fue en un intento por responder a esas preguntas que nos adentramos en el terreno para crear ‘Voces del Sur’, dice Luciana Julião.
Y menuda tarea: para llevar a cabo la investigación, Luciana Julião y los periodistas Luciana Colodete, en Brasil, y Fernando Vives, en Australia, se embarcaron en meses de entrevistas con académicos y pueblos indígenas para descubrir los proyectos medioambientales en curso en ambos países, en las áreas de gestión forestal, gestión de incendios, protección de los océanos, minería, agricultura y ganadería, y energías renovables.
«Hubo unas 40 horas de entrevistas con más de 20 científicos e investigadores en ambos países», afirma la coordinadora del proyecto, que pasó varias semanas en el interior de Pará y en las regiones mineras de Minas Gerais para visitar iniciativas medioambientales emblemáticas y entrevistar a sus responsables. Mientras tanto, el reportero Fernando Vives, un brasileño que lleva 20 años viviendo en Australia, recorrió universidades y centros de investigación medioambiental para recopilar ejemplos de allí.
La producción también se benefició de la coproducción logística y de contenidos de investigadores y personal técnico de la Universidad Federal de Pará (UFPA), liderada por la profesora Maria Ataide Malcher, del Centro de Innovación y Tecnologías Aplicadas a la Enseñanza y la Extensión.
Todos los episodios de «Voces del Sur» están disponibles en las principales plataformas de audio o directamente aquí, en los reproductores que aparecen a continuación, en español, inglés y en portugués.
El 28 de abril de 2025, la España peninsular sufrió un apagón eléctrico total. Se inició a las 12:32 horas y también afectó a Portugal, Andorra y el sur de Francia. El restablecimiento del servicio tardó un número variable de horas, dependiendo de las zonas pero, en su conjunto, el suceso tuvo un fuerte impacto económico.
Sobre las causas, el reciente informe de la Red Europea de Gestores de Redes de Transporte de Electricidad (ENTSO-e) ha acotado mucho (que no cerrado) el debate. Pero sobre las consecuencias es incluso más difícil establecer un consenso: primero, porque se miden y mezclan conceptos distintos, y segundo, porque el año transcurrido ha estado tan repleto de otros eventos con fuerte impacto en el sector energético que resulta complejo separar causalidades.
En lo referente al coste del apagón, las primeras estimaciones, como las de la CEOE o Caixabank lo situaron en el entorno de los 1 600 millones de euros, un 0,1 % del PIB anual de España. Un año después, esa sigue pareciendo una cifra razonable.
La cara más visible de este coste son las indemnizaciones, reclamaciones y expedientes sancionadores que todavía no han terminado de concretarse pero que sumarán, en cualquier caso, varios cientos de millones de euros. A ese coste cuantificable en procesos administrativos y judiciales hay que sumar otros, como los aproximadamente 50 millones que costó reestablecer el servicio, y los cerca de 666 millones de la operación reforzada, que implica tener disponibles más centrales convencionales (ciclos combinados, nucleares o hidráulicas) para poder utilizarlas ante cualquier desequilibrio del sistema. Esto ha encarecido el precio de la factura eléctrica de los consumidores españoles.
Recurrir más a las centrales de ciclo combinado para reducir los riesgos de un nuevo apagón tiene un coste. La propia Redeia lo cuantifica en un 4,7 % sobre un precio medio de 77,07 €/MWh, que es de donde se obtiene el coste global anterior de 666 millones. Quizás más relevante que ese efecto directo sea la perspectiva a más largo plazo de la evolución de los precios de la electricidad, que en los últimos tiempos ha estado marcada por la guerra de Ucrania y las respuestas que generó en cada país, los que ha llevado a una amplia dispersión en los precios de las cuatro mayores economías de la Unión Europea.
La interconexión
Estas diferencias responden tanto a diferencias en marcos regulatorios como a las barreras al flujo de energía entre países. Las interconexiones, que deberían contribuir a una producción más eficiente y una distribución más robusta, han avanzado poco este último año. ¿La razones? Estas inversiones requieren mucho más tiempo para diseñarse, aprobarse e implementarse, y, si nos referimos a la conexión con Francia desde el sistema ibérico, la parte que sufrió el apagón es la que ya tenía más interés en impulsar la conexión.
La crisis de Oriente Medio ha afectado por múltiples vías a los mercados energéticos globales. Para entender su efecto sobre los mercados de electricidad hay que partir de que los combustibles fósiles son materia prima para la producción de electricidad y, a la vez, un sustituto final de la misma.
Como insumo, el aumento del precio del gas y el petróleo ha impactado más donde son más relevantes en la producción de electricidad y donde esa subida tiene mecanismos adicionales de contagio, como pueden ser los mercados marginalistas, en los que la fuente de energía más cara marca el precio del resto.
Un efecto secundario no desdeñable de ese aumento es el impulso que da a la instalación de fuentes renovables. En 2025 han superado, por primera vez en un siglo a nivel global, a la producción de electricidad con carbón. La generación de electricidad con fuentes limpias ya no es solo una cuestión de ecología, ni siquiera de economía, ahora es también una cuestión de soberanía y de seguridad nacional.
Esta crisis no solo afecta al coste de la electricidad según su origen, también afecta a la demanda de electricidad al ser, cada vez más, una energía sustituta de las energías fósiles, por ejemplo, en la movilidad. El crecimiento del mercado de vehículos eléctricos, los centros de datos y el propio crecimiento de la economía mundial incrementan la demanda global de energía eléctrica.
Un elemento central en todo este proceso es el aumento en la eficiencia de los sistemas de almacenamiento eléctrico. Si las baterías de coche brindan más autonomía y son más baratas y fáciles de recargar, la mejora en las baterías estacionarias (instalaciones fijas diseñadas para soportar procesos profundos y reiterados de carga y descarga) son un espaldarazo al cambio a las energías renovables.
El gran problema al que se enfrenta el crecimiento de las energías renovables –en particular la eólica y la fotovoltaica– es el de una oferta no gestionable, que implica que cuanta más energía limpia generan menos vale, lo que las atrapa en un bucle que limita su cuota en el conjunto del sistema.
Las baterías estacionarias, junto con otros sistemas de almacenamiento como las centrales reversibles, permiten acumular energía cuando el sistema ofrece precios cercanos a cero para luego verterla. Incluso dos veces al día, porque con frecuencia los precios diarios tienen dos valles: uno por exceso de oferta a plena luz y otro (menor y más aleatorio) por falta de demanda en la noche.
Un último elemento a considerar es la enorme capacidad inversora china en el sector de la energía eléctrica. Sus empresas han acumulado un importante exceso de capacidad (en plantas de producción de células fotovoltaicas, baterías y coches), lo que ayuda a la transición energética global sin graves tensiones en los precios ni el suministro.
La lección
Aunque la experiencia del apagón eléctrico de hace un año ha tenido un precio en la factura eléctrica de los españoles –el 5 % de sobrecoste asociado a la producción reforzada y el 0,1 % del PIB asociado directamente al apagón– ha quedado ensombrecido por la crisis energética actual. No obstante, todos estos eventos reiteran la necesidad de contar con un suministro eléctrico seguro.
Diego Peñarrubia es miembro de Greenpeace, PSOE y UGT, sin ocupar ni haber ocupado ningún puesto en la dirección de ninguna de estas organizaciones.


